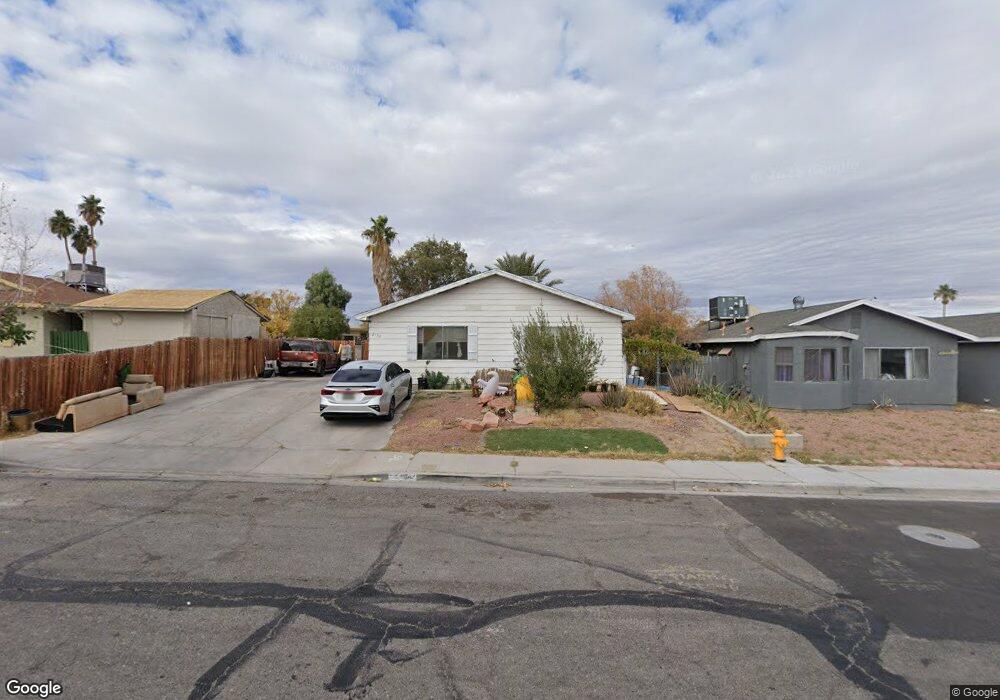
4758 San Leandro Ave Unit 6B Las Vegas, NV 89120
Paradise Valley East NeighborhoodEstimated Value: $332,000 - $380,000
4
Beds
2
Baths
1,350
Sq Ft
$265/Sq Ft
Est. Value
About This Home
This home is located at 4758 San Leandro Ave Unit 6B, Las Vegas, NV 89120 and is currently estimated at $357,984, approximately $265 per square foot. 4758 San Leandro Ave Unit 6B is a home located in Clark County with nearby schools including Harley Harmon Elementary School, Francis H Cortney Junior High School, and Del Sol Academy of the Performing Arts.
Ownership History
Date
Name
Owned For
Owner Type
Purchase Details
Closed on
Mar 10, 2023
Sold by
Rapel Trust
Bought by
Rapel Stephanie
Current Estimated Value
Purchase Details
Closed on
Feb 12, 2021
Sold by
Ben Moshe Yehuda and Rapel Stephanie
Bought by
Ben Moshe Yehuda and Rapel Stephanie
Purchase Details
Closed on
Jan 12, 2021
Sold by
Ben-Moshe Yehuda
Bought by
Ben-Moshe And Rapel Trust and Ben-Moshe
Purchase Details
Closed on
Dec 1, 2011
Sold by
Deutsche Bank National Trust Company
Bought by
Ben Moshe Yehuda and Rapel Stephanie
Purchase Details
Closed on
Oct 3, 2011
Sold by
Jimenez Jose Luis and Jimenez Olivia
Bought by
Deutsche Bank National Trust Company
Purchase Details
Closed on
Mar 8, 2005
Sold by
Jimenez Jose L
Bought by
Jimenez Jose Luis and Jimenez Olivia
Home Financials for this Owner
Home Financials are based on the most recent Mortgage that was taken out on this home.
Original Mortgage
$125,000
Interest Rate
9.3%
Mortgage Type
New Conventional
Create a Home Valuation Report for This Property
The Home Valuation Report is an in-depth analysis detailing your home's value as well as a comparison with similar homes in the area
Home Values in the Area
Average Home Value in this Area
Purchase History
| Date | Buyer | Sale Price | Title Company |
|---|---|---|---|
| Rapel Stephanie | -- | Noble Title | |
| Ben Moshe Yehuda | -- | None Available | |
| Ben-Moshe And Rapel Trust | -- | None Listed On Document | |
| Ben Moshe Yehuda | $42,000 | Chicago Title Las Vegas | |
| Deutsche Bank National Trust Company | $36,750 | Ticor Title Las Vegas | |
| Jimenez Jose Luis | -- | Lawyers Title Of Nevada |
Source: Public Records
Mortgage History
| Date | Status | Borrower | Loan Amount |
|---|---|---|---|
| Previous Owner | Jimenez Jose Luis | $125,000 |
Source: Public Records
Tax History Compared to Growth
Tax History
| Year | Tax Paid | Tax Assessment Tax Assessment Total Assessment is a certain percentage of the fair market value that is determined by local assessors to be the total taxable value of land and additions on the property. | Land | Improvement |
|---|---|---|---|---|
| 2025 | $771 | $41,927 | $24,850 | $17,077 |
| 2024 | $714 | $41,927 | $24,850 | $17,077 |
| 2023 | $714 | $45,843 | $30,450 | $15,393 |
| 2022 | $662 | $37,548 | $23,800 | $13,748 |
| 2021 | $613 | $35,562 | $22,750 | $12,812 |
| 2020 | $566 | $33,508 | $20,300 | $13,208 |
| 2019 | $531 | $30,967 | $17,500 | $13,467 |
| 2018 | $506 | $28,652 | $15,400 | $13,252 |
| 2017 | $784 | $26,747 | $12,950 | $13,797 |
| 2016 | $475 | $23,365 | $8,750 | $14,615 |
| 2015 | $473 | $20,660 | $6,300 | $14,360 |
| 2014 | $458 | $18,373 | $5,250 | $13,123 |
Source: Public Records
Map
Nearby Homes
- 4674 Petaluma Cir
- 4676 Tamalpias Ave
- 5086 Mountain Vista St
- 4715 Mill Valley Dr
- 5225 Saratoga Dr
- 4647 Mill Valley Dr
- 5155 Saratoga Dr
- 4805 Terra Linda Ave
- 5383 Mountain Vista St Unit 31
- 5022 Carmel Ave Unit 3
- 4845 S Mountain Vista St
- 4999 Nellis Cir
- 5030 E Hacienda Ave
- 5077 Myrtlewood Ave
- 4945 Rita Dr
- 4655 Bennett Dr
- 4944 Rita Dr
- 4727 Conrad St
- 4345 Quay Ct Unit 5
- 5122 Gregg Place
- 4764 San Leandro Ave
- 4724 Livermore Ave Unit 6B
- 4735 San Rafael Ave
- 4729 San Rafael Ave
- 4741 San Rafael Ave
- 4723 San Rafael Ave
- 4718 Livermore Ave
- 4755 San Leandro Ave
- 4747 San Rafael Ave
- 4761 San Leandro Ave
- 4749 San Leandro Ave
- 4767 San Leandro Ave
- 4734 San Leandro Ave
- 4717 San Rafael Ave
- 4743 San Leandro Ave
- 4712 Livermore Ave
- 4773 San Leandro Ave
- 4711 Livermore Ave
- 4711 San Rafael Ave
- 4736 San Rafael Ave