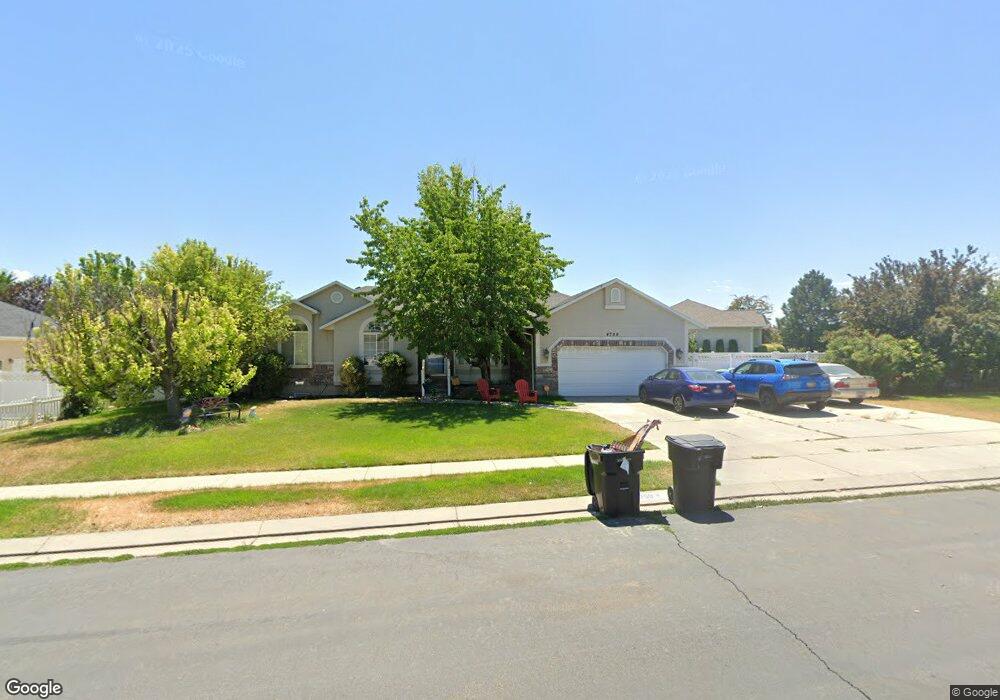
4759 Baldy Dr West Jordan, UT 84088
Cobble Creek NeighborhoodEstimated Value: $611,000 - $654,000
3
Beds
2
Baths
1,626
Sq Ft
$389/Sq Ft
Est. Value
About This Home
This home is located at 4759 Baldy Dr, West Jordan, UT 84088 and is currently estimated at $632,043, approximately $388 per square foot. 4759 Baldy Dr is a home located in Salt Lake County with nearby schools including Hayden Peak Elementary School, West Hills Middle School, and Copper Hills High School.
Ownership History
Date
Name
Owned For
Owner Type
Purchase Details
Closed on
Dec 19, 2016
Sold by
Heinecke Richard J
Bought by
Heinecke Richard J and Heinecke Kerrie Ann
Current Estimated Value
Home Financials for this Owner
Home Financials are based on the most recent Mortgage that was taken out on this home.
Original Mortgage
$259,259
Interest Rate
4.4%
Mortgage Type
FHA
Purchase Details
Closed on
Jul 3, 2007
Sold by
Heinecke Richard J
Bought by
Heinecke Richard J and Heinecke Kerrie Ann
Home Financials for this Owner
Home Financials are based on the most recent Mortgage that was taken out on this home.
Original Mortgage
$84,880
Interest Rate
6.41%
Mortgage Type
Credit Line Revolving
Purchase Details
Closed on
Apr 12, 2000
Sold by
Heinecke Richard J and Heinecke Kerrie Ann
Bought by
Heinecke Richard J and Heinecke Kerrie Ann
Create a Home Valuation Report for This Property
The Home Valuation Report is an in-depth analysis detailing your home's value as well as a comparison with similar homes in the area
Home Values in the Area
Average Home Value in this Area
Purchase History
| Date | Buyer | Sale Price | Title Company |
|---|---|---|---|
| Heinecke Richard J | -- | Benchmark Title Ins Agency | |
| Heinecke Richard J | -- | Benchmark Title Ins Agency | |
| Heinecke Richard J | -- | Equity Title | |
| Heinecke Richard J | -- | Equity Title | |
| Heinecke Richard J | -- | Brighton Title |
Source: Public Records
Mortgage History
| Date | Status | Borrower | Loan Amount |
|---|---|---|---|
| Closed | Heinecke Richard J | $259,259 | |
| Closed | Heinecke Richard J | $84,880 |
Source: Public Records
Tax History Compared to Growth
Tax History
| Year | Tax Paid | Tax Assessment Tax Assessment Total Assessment is a certain percentage of the fair market value that is determined by local assessors to be the total taxable value of land and additions on the property. | Land | Improvement |
|---|---|---|---|---|
| 2025 | $3,077 | $597,500 | $178,800 | $418,700 |
| 2024 | $3,077 | $592,000 | $177,000 | $415,000 |
| 2023 | $3,077 | $564,900 | $167,000 | $397,900 |
| 2022 | $3,131 | $558,600 | $163,700 | $394,900 |
| 2021 | $2,456 | $433,100 | $127,200 | $305,900 |
| 2020 | $2,478 | $377,600 | $127,200 | $250,400 |
| 2019 | $2,444 | $365,300 | $120,100 | $245,200 |
| 2018 | $2,324 | $344,500 | $120,100 | $224,400 |
| 2017 | $2,267 | $334,500 | $120,100 | $214,400 |
| 2016 | $2,099 | $291,000 | $120,100 | $170,900 |
| 2015 | $2,197 | $297,000 | $126,900 | $170,100 |
| 2014 | $2,028 | $269,900 | $116,700 | $153,200 |
Source: Public Records
Map
Nearby Homes
- 4678 Emmons Dr
- 7973 S Nebo Dr
- 7903 Mckenzie Ln
- 7886 Mckenzie Ln
- 7908 Cold Stone Ln Unit N3
- 8359 Etude Dr
- 5183 W Swift Water Way
- 5189 W Dove Creek Ln
- 7882 S Dove Creek Ln Unit A6
- 8322 Copper Vista Cir
- 5228 W Ranches Loop Rd
- 7502 S Lace Wood Dr Unit 417
- 7518 Park Village Dr
- 7493 S Lace Wood Dr
- 5298 W Icehouse Way
- 4887 W 8620 S
- 7877 S 5440 W Unit 119
- 5422 W Island Creek Dr
- 8577 Autumn Gold Cir
- 8441 S Spratling Dr
- 7989 Baldy Dr
- 4743 W Baldy Dr
- 4743 Baldy Dr
- 7989 S Baldy Dr Unit 401
- 4728 W Emmons Dr
- 4728 Emmons Dr
- 4752 Baldy Dr
- 4752 W Baldy Dr
- 4764 Baldy Dr
- 4716 Emmons Dr
- 8009 Baldy Dr
- 8009 S Baldy Dr
- 7968 Baldy Dr
- 7984 S Baldy Dr
- 4727 Baldy Dr
- 8002 Hillers Dr
- 4738 W Baldy Dr
- 4704 W Emmons Dr
- 4704 Emmons Dr
- 8023 Baldy Dr