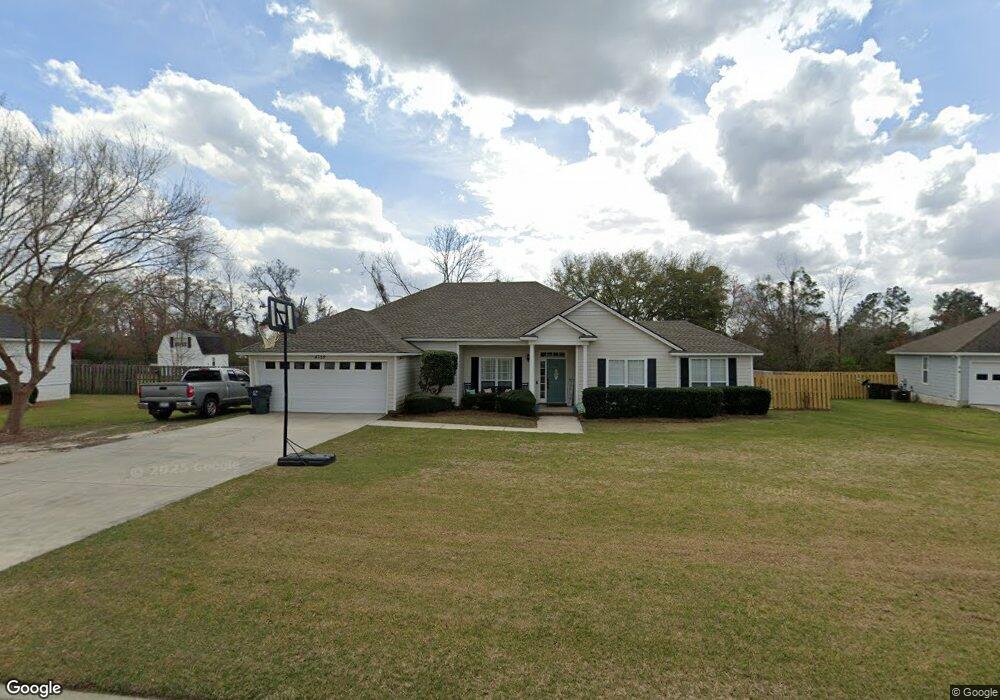
4759 Ben Salem Way Hahira, GA 31632
Estimated Value: $319,000 - $343,000
4
Beds
2
Baths
2,121
Sq Ft
$156/Sq Ft
Est. Value
About This Home
This home is located at 4759 Ben Salem Way, Hahira, GA 31632 and is currently estimated at $330,735, approximately $155 per square foot. 4759 Ben Salem Way is a home located in Lowndes County with nearby schools including Hahira Elementary School, Hahira Middle School, and Lowndes High School.
Ownership History
Date
Name
Owned For
Owner Type
Purchase Details
Closed on
Jul 14, 2017
Sold by
Redish Clifton L
Bought by
Smith Amy
Current Estimated Value
Home Financials for this Owner
Home Financials are based on the most recent Mortgage that was taken out on this home.
Original Mortgage
$166,000
Outstanding Balance
$137,994
Interest Rate
3.91%
Mortgage Type
New Conventional
Estimated Equity
$192,741
Purchase Details
Closed on
Jun 10, 2005
Sold by
Bello Alfred P
Bought by
Redish Clifton L and Redish Dorothy J
Home Financials for this Owner
Home Financials are based on the most recent Mortgage that was taken out on this home.
Original Mortgage
$168,803
Interest Rate
5.7%
Mortgage Type
New Conventional
Purchase Details
Closed on
Aug 20, 2001
Sold by
Tlg Inc
Bought by
Bello Alfred P and Bello Carla J
Purchase Details
Closed on
Jan 14, 1994
Bought by
Tlg Inc
Create a Home Valuation Report for This Property
The Home Valuation Report is an in-depth analysis detailing your home's value as well as a comparison with similar homes in the area
Home Values in the Area
Average Home Value in this Area
Purchase History
| Date | Buyer | Sale Price | Title Company |
|---|---|---|---|
| Smith Amy | $184,000 | -- | |
| Redish Clifton L | $169,900 | -- | |
| Bello Alfred P | $152,300 | -- | |
| Tlg Inc | -- | -- |
Source: Public Records
Mortgage History
| Date | Status | Borrower | Loan Amount |
|---|---|---|---|
| Open | Smith Amy | $166,000 | |
| Previous Owner | Redish Clifton L | $168,803 |
Source: Public Records
Tax History Compared to Growth
Tax History
| Year | Tax Paid | Tax Assessment Tax Assessment Total Assessment is a certain percentage of the fair market value that is determined by local assessors to be the total taxable value of land and additions on the property. | Land | Improvement |
|---|---|---|---|---|
| 2024 | $2,623 | $107,972 | $13,200 | $94,772 |
| 2023 | $2,494 | $107,972 | $13,200 | $94,772 |
| 2022 | $2,121 | $79,888 | $13,200 | $66,688 |
| 2021 | $2,213 | $79,888 | $13,200 | $66,688 |
| 2020 | $1,773 | $69,289 | $13,200 | $56,089 |
| 2019 | $1,791 | $69,289 | $13,200 | $56,089 |
| 2018 | $1,974 | $69,289 | $13,200 | $56,089 |
| 2017 | $1,830 | $69,289 | $13,200 | $56,089 |
| 2016 | $1,834 | $69,289 | $13,200 | $56,089 |
| 2015 | -- | $69,289 | $13,200 | $56,089 |
| 2014 | $1,795 | $69,289 | $13,200 | $56,089 |
Source: Public Records
Map
Nearby Homes
- 4759 Bethany Dr
- 4958 Bethany Dr
- 3800 Cutshaw Trail
- 4710 Summerfield Dr
- The Carol Plan at Ballantyne
- The Ryleigh Plan at Ballantyne
- The Embry Plan at Ballantyne
- The Belfort Plan at Ballantyne
- 1000 Ballantyne Ln
- 4176 Cider Trail
- 5460 Union Rd
- 4167 Silver Glen
- 4160 Willow Round Rd
- 3908 Cutshaw Trail
- 4193 Nelson Hill Place
- 5388 Hall Rd
- 4209 Parker Trail
- 4122 Nelson Hill Place
- 4029 Ashbourne Dr
- Lot 7 Mcmillan Rd
- 4765 Ben Salem Way
- 4747 Ben Salem Way
- 4756 Ben Salem Way
- 4771 Ben Salem Way
- 4741 Ben Salem Way
- 4778 Ben Salem Way
- 4744 Ben Salem Way
- 4819 Ellens Walk
- 4777 Ben Salem Way
- 4735 Ben Salem Way
- 4736 Ben Salem Way
- 4786 Ben Salem Way
- 4854 Bethany Dr
- 4818 Ellen's Walk
- 4818 Ellens Walk
- 4827 Ellens Walk
- 4730 Ben Salem Way
- 4727 Ben Salem Way
- 4783 Ben Salem Way