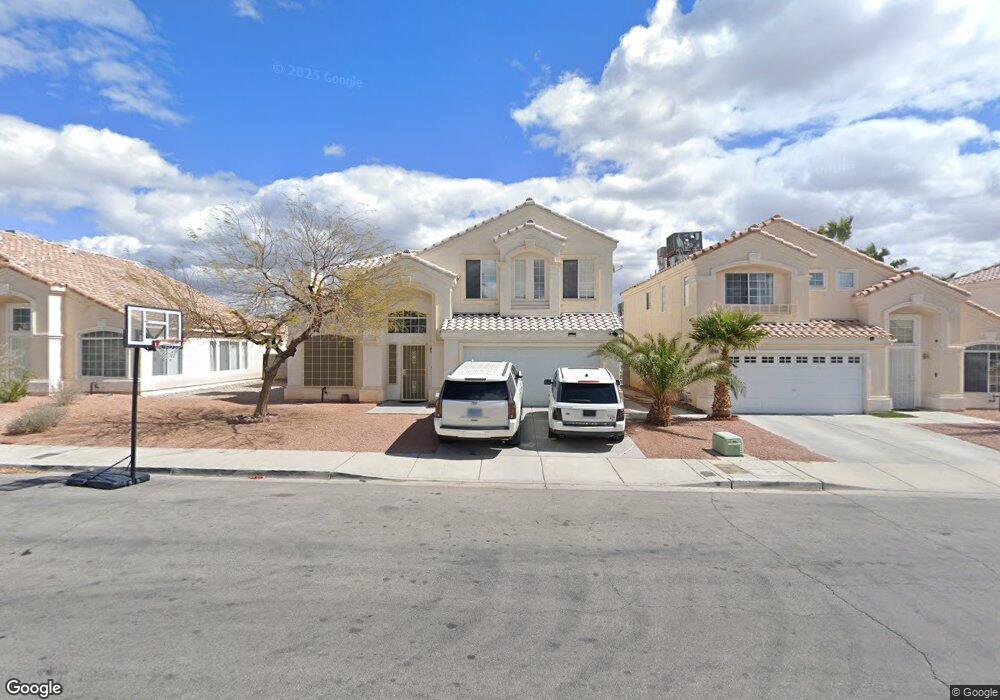
4759 Crakow Ct Las Vegas, NV 89147
Rancho Viejo NeighborhoodEstimated Value: $509,000 - $524,201
3
Beds
3
Baths
2,290
Sq Ft
$226/Sq Ft
Est. Value
About This Home
This home is located at 4759 Crakow Ct, Las Vegas, NV 89147 and is currently estimated at $517,800, approximately $226 per square foot. 4759 Crakow Ct is a home located in Clark County with nearby schools including Keith C. & Karen W. Hayes Elementary School, Clifford J Lawrence Junior High School, and Durango High School.
Ownership History
Date
Name
Owned For
Owner Type
Purchase Details
Closed on
Nov 19, 2020
Sold by
Kakani Kalyana C and Sunkara Sudharani
Bought by
Mcintosh Jason and Biebel Jennifer
Current Estimated Value
Home Financials for this Owner
Home Financials are based on the most recent Mortgage that was taken out on this home.
Original Mortgage
$346,606
Outstanding Balance
$308,430
Interest Rate
2.8%
Mortgage Type
FHA
Estimated Equity
$209,370
Purchase Details
Closed on
Feb 27, 2004
Sold by
Kakani Kalyana and Sunkara Sudharani
Bought by
Kakani Kalyana C and Sunkara Sudharani
Purchase Details
Closed on
Apr 16, 2001
Sold by
Granada Hills Partnership
Bought by
Kakani Kalyana and Sunkara Sudharani
Home Financials for this Owner
Home Financials are based on the most recent Mortgage that was taken out on this home.
Original Mortgage
$140,749
Interest Rate
6.98%
Create a Home Valuation Report for This Property
The Home Valuation Report is an in-depth analysis detailing your home's value as well as a comparison with similar homes in the area
Home Values in the Area
Average Home Value in this Area
Purchase History
| Date | Buyer | Sale Price | Title Company |
|---|---|---|---|
| Mcintosh Jason | $353,000 | Equity Title Of Nevada | |
| Kakani Kalyana C | -- | -- | |
| Kakani Kalyana | $175,937 | Land Title |
Source: Public Records
Mortgage History
| Date | Status | Borrower | Loan Amount |
|---|---|---|---|
| Open | Mcintosh Jason | $346,606 | |
| Previous Owner | Kakani Kalyana | $140,749 |
Source: Public Records
Tax History Compared to Growth
Tax History
| Year | Tax Paid | Tax Assessment Tax Assessment Total Assessment is a certain percentage of the fair market value that is determined by local assessors to be the total taxable value of land and additions on the property. | Land | Improvement |
|---|---|---|---|---|
| 2025 | $2,810 | $120,864 | $40,950 | $79,914 |
| 2024 | $3,016 | $120,864 | $40,950 | $79,914 |
| 2023 | $3,148 | $109,446 | $33,950 | $75,496 |
| 2022 | $2,649 | $100,522 | $31,500 | $69,022 |
| 2021 | $2,453 | $94,007 | $28,350 | $65,657 |
| 2020 | $2,275 | $91,026 | $25,900 | $65,126 |
| 2019 | $2,132 | $88,613 | $24,500 | $64,113 |
| 2018 | $2,034 | $81,492 | $20,300 | $61,192 |
| 2017 | $2,412 | $82,258 | $20,300 | $61,958 |
| 2016 | $1,905 | $75,893 | $14,000 | $61,893 |
| 2015 | $1,900 | $63,419 | $14,000 | $49,419 |
| 2014 | $1,845 | $61,674 | $10,150 | $51,524 |
Source: Public Records
Map
Nearby Homes
- 9123 Scallop Reef Ave
- 9050 W Tropicana Ave Unit 1107
- 9050 W Tropicana Ave Unit 1073
- 9050 W Tropicana Ave Unit 1086
- 9050 W Tropicana Ave Unit 1066
- 9050 W Tropicana Ave Unit 1113
- 9050 W Tropicana Ave Unit 1178
- 9050 W Tropicana Ave Unit 1125
- 9050 W Tropicana Ave Unit 1017
- 9050 W Tropicana Ave Unit 1027
- 9050 W Tropicana Ave Unit 1170
- 9050 W Tropicana Ave Unit 1053
- 9050 W Tropicana Ave Unit 1009
- 8983 Odense Way
- 9154 W Naples Dr
- 4927 Spanish Heights Dr
- 4607 El Camino Cabos Dr
- 8839 La Manga Ave
- 4944 Spanish Heights Dr
- 4680 Laguna Vista St
- 4765 Crakow Ct
- 9090 Red Shores Way
- 9080 Red Shores Way Unit 2
- 4756 Lone Mesa Dr
- 4760 Crakow Ct
- 4764 Lone Mesa Dr Unit 2
- 4771 Crakow Ct Unit 2
- 9070 Red Shores Way Unit 2
- 4768 Crakow Ct Unit 2
- 4772 Lone Mesa Dr
- 4740 Lone Mesa Dr Unit 2
- 4777 Crakow Ct
- 9060 Red Shores Way
- 4778 Crakow Ct
- 4778 Lone Mesa Dr
- 4777 Essen Ct
- 4757 Ashington St
- 9108 Sangria Ln
- 4767 Ashington St Unit 2
- 4780 Lone Mesa Dr