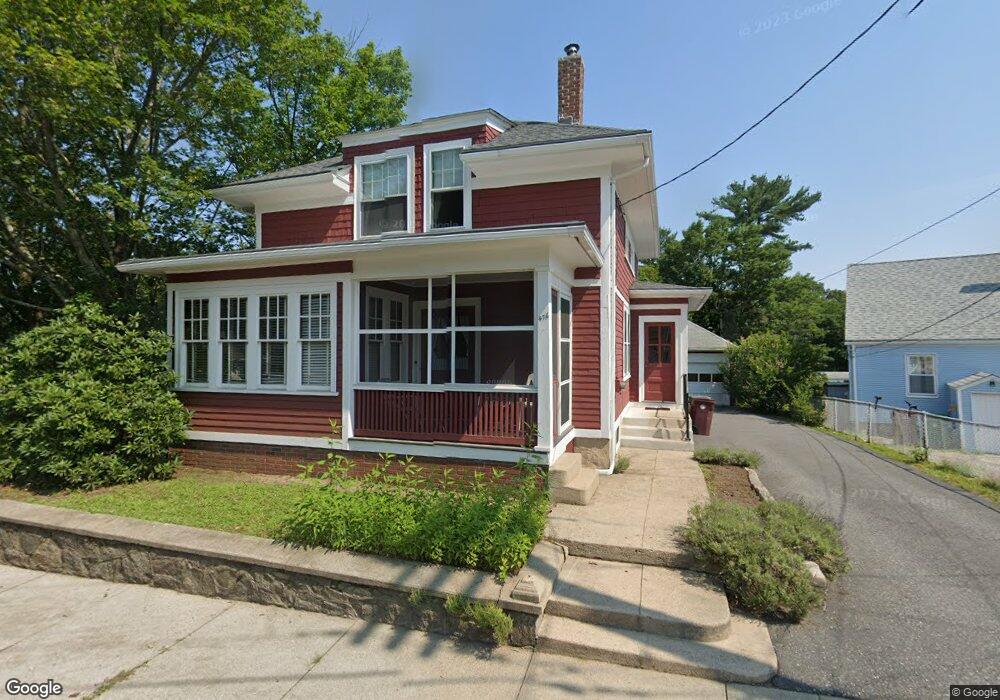
476 Ballou St Woonsocket, RI 02895
Globe District NeighborhoodEstimated Value: $309,697 - $374,000
4
Beds
1
Bath
1,176
Sq Ft
$290/Sq Ft
Est. Value
About This Home
This home is located at 476 Ballou St, Woonsocket, RI 02895 and is currently estimated at $340,924, approximately $289 per square foot. 476 Ballou St is a home located in Providence County with nearby schools including Woonsocket High School, Founders Academy, and Beacon Charter School.
Ownership History
Date
Name
Owned For
Owner Type
Purchase Details
Closed on
Jan 5, 2026
Sold by
Beauregard Christine K and Kula Elizabeth M
Bought by
Equity T Co Custodian 202
Current Estimated Value
Purchase Details
Closed on
Sep 19, 2016
Sold by
Kula Madeleine M
Bought by
Kula-Beauregard Christine and Kula Elizabeth M
Purchase Details
Closed on
Sep 7, 2016
Sold by
Kula Bernard and Kula Meadeleine M
Bought by
Kula Meadeleine M
Purchase Details
Closed on
Jan 1, 1987
Bought by
Kula Bernard and Kula Madeleine M
Create a Home Valuation Report for This Property
The Home Valuation Report is an in-depth analysis detailing your home's value as well as a comparison with similar homes in the area
Home Values in the Area
Average Home Value in this Area
Purchase History
| Date | Buyer | Sale Price | Title Company |
|---|---|---|---|
| Equity T Co Custodian 202 | $230,000 | -- | |
| Kula-Beauregard Christine | -- | -- | |
| Kula Meadeleine M | -- | -- | |
| Kula Bernard | -- | -- | |
| Kula-Beauregard Christine | -- | -- | |
| Kula Meadeleine M | -- | -- |
Source: Public Records
Tax History
| Year | Tax Paid | Tax Assessment Tax Assessment Total Assessment is a certain percentage of the fair market value that is determined by local assessors to be the total taxable value of land and additions on the property. | Land | Improvement |
|---|---|---|---|---|
| 2025 | $3,304 | $294,200 | $102,600 | $191,600 |
| 2024 | $3,567 | $245,300 | $91,100 | $154,200 |
| 2023 | $3,429 | $245,300 | $91,100 | $154,200 |
| 2022 | $3,429 | $245,300 | $91,100 | $154,200 |
| 2021 | $3,503 | $147,500 | $55,400 | $92,100 |
| 2020 | $3,540 | $147,500 | $55,400 | $92,100 |
| 2018 | $3,552 | $147,500 | $55,400 | $92,100 |
| 2017 | $3,543 | $117,700 | $44,700 | $73,000 |
| 2016 | $3,748 | $117,700 | $44,700 | $73,000 |
| 2015 | $4,305 | $117,700 | $44,700 | $73,000 |
| 2014 | $4,126 | $114,800 | $49,200 | $65,600 |
Source: Public Records
Map
Nearby Homes
- 1 Admiral St
- 43 Summit St
- 122 Grand St
- 635 Park Ave
- 87 Kermit St
- 184 Avenue C Unit 2
- 184 Avenue C Unit 5
- 184 Avenue C Unit 6
- 184 Avenue C Unit 3
- 184 Avenue C Unit 4
- 184 Avenue C Unit 1
- 190 Coe St
- 15 Knight St
- 147 Warwick St
- 109 Hemond Ave
- 0 Irving Lot 192 Ave Unit 1383138
- 59 Cooper Ave
- 435 S Main St
- 0 Holbrook Ln Unit 1402850
- 379 Front St
Your Personal Tour Guide
Ask me questions while you tour the home.