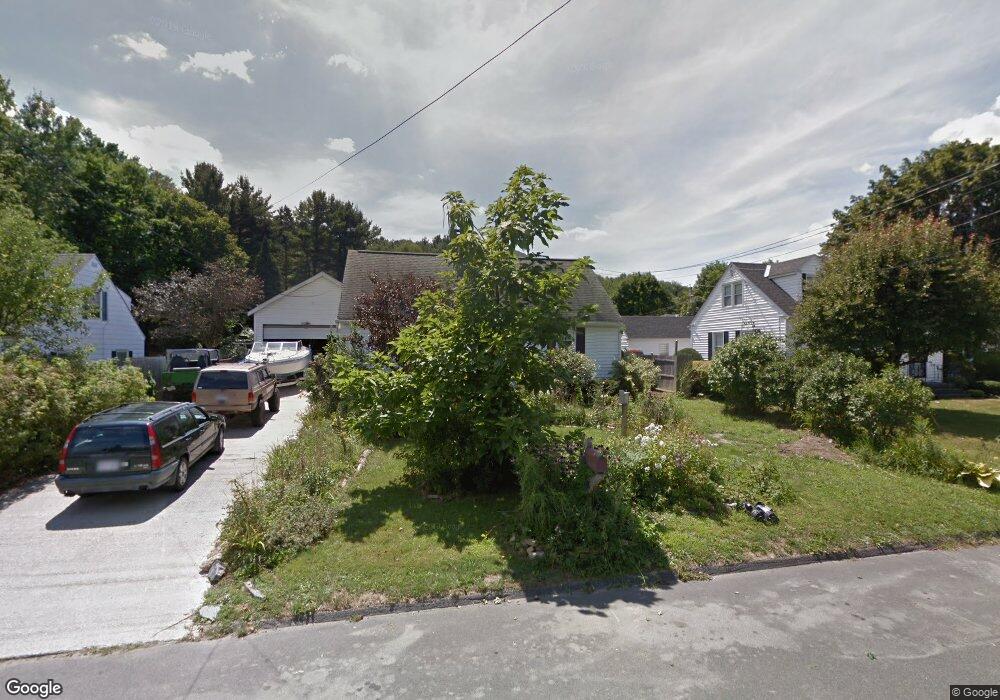
476 Barbour St North Adams, MA 01247
Estimated Value: $253,000 - $288,000
3
Beds
1
Bath
1,497
Sq Ft
$185/Sq Ft
Est. Value
About This Home
This home is located at 476 Barbour St, North Adams, MA 01247 and is currently estimated at $276,317, approximately $184 per square foot. 476 Barbour St is a home located in Berkshire County with nearby schools including Greylock Elementary School, Drury High School, and Pine Cobble School.
Ownership History
Date
Name
Owned For
Owner Type
Purchase Details
Closed on
Oct 5, 2018
Sold by
Fillion Michael P
Bought by
Smithers J Megan
Current Estimated Value
Purchase Details
Closed on
Mar 14, 2016
Sold by
Smithers Rosamond J
Bought by
Fillion Michael J and Fillion Megan Smithers
Purchase Details
Closed on
Oct 6, 2000
Sold by
Stevens-Bryson Gail D
Bought by
Smithers Rosamond J
Create a Home Valuation Report for This Property
The Home Valuation Report is an in-depth analysis detailing your home's value as well as a comparison with similar homes in the area
Home Values in the Area
Average Home Value in this Area
Purchase History
| Date | Buyer | Sale Price | Title Company |
|---|---|---|---|
| Smithers J Megan | -- | -- | |
| Fillion Michael J | -- | -- | |
| Smithers Rosamond J | $85,000 | -- | |
| Smithers J Megan | -- | -- | |
| Fillion Michael J | -- | -- | |
| Smithers Rosamond J | $85,000 | -- |
Source: Public Records
Tax History Compared to Growth
Tax History
| Year | Tax Paid | Tax Assessment Tax Assessment Total Assessment is a certain percentage of the fair market value that is determined by local assessors to be the total taxable value of land and additions on the property. | Land | Improvement |
|---|---|---|---|---|
| 2025 | $3,947 | $236,200 | $44,600 | $191,600 |
| 2024 | $3,738 | $218,100 | $40,800 | $177,300 |
| 2023 | $3,661 | $207,200 | $40,800 | $166,400 |
| 2022 | $3,326 | $179,500 | $40,800 | $138,700 |
| 2021 | $3,093 | $166,200 | $37,800 | $128,400 |
| 2020 | $2,905 | $156,000 | $37,500 | $118,500 |
| 2019 | $2,742 | $143,500 | $34,700 | $108,800 |
| 2018 | $2,638 | $143,500 | $36,500 | $107,000 |
| 2017 | $2,511 | $142,100 | $36,100 | $106,000 |
| 2016 | $2,435 | $140,000 | $36,100 | $103,900 |
| 2015 | $2,337 | $140,000 | $36,100 | $103,900 |
Source: Public Records
Map
Nearby Homes