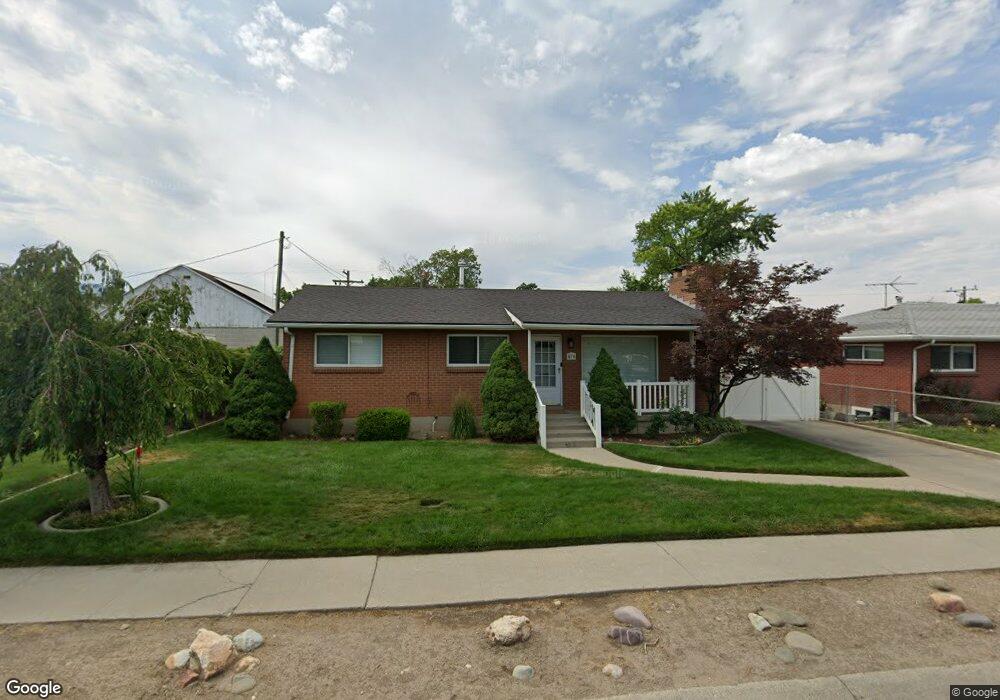
476 E 6815 S Midvale, UT 84047
Estimated Value: $529,611 - $621,000
4
Beds
3
Baths
2,100
Sq Ft
$266/Sq Ft
Est. Value
About This Home
This home is located at 476 E 6815 S, Midvale, UT 84047 and is currently estimated at $557,903, approximately $265 per square foot. 476 E 6815 S is a home located in Salt Lake County with nearby schools including East Midvale Elementary School, Hillcrest High School, and Midvale Middle School.
Ownership History
Date
Name
Owned For
Owner Type
Purchase Details
Closed on
Dec 27, 2022
Sold by
Politis Anthony G
Bought by
Anthony Politis Family Trust
Current Estimated Value
Purchase Details
Closed on
Oct 31, 2022
Sold by
Politis Anthony
Bought by
Anthony Politis Family Trust
Purchase Details
Closed on
Sep 28, 2006
Sold by
Kammerer Kelly D and Kammerer Terri L
Bought by
Politis Anthony G
Home Financials for this Owner
Home Financials are based on the most recent Mortgage that was taken out on this home.
Original Mortgage
$34,875
Interest Rate
6.18%
Mortgage Type
Stand Alone Second
Purchase Details
Closed on
Feb 20, 2003
Sold by
Horrocks William L and Horrocks Mary M
Bought by
Kammerer Kelly D and Kammerer Terri L
Home Financials for this Owner
Home Financials are based on the most recent Mortgage that was taken out on this home.
Original Mortgage
$163,886
Interest Rate
5.89%
Mortgage Type
VA
Create a Home Valuation Report for This Property
The Home Valuation Report is an in-depth analysis detailing your home's value as well as a comparison with similar homes in the area
Home Values in the Area
Average Home Value in this Area
Purchase History
| Date | Buyer | Sale Price | Title Company |
|---|---|---|---|
| Anthony Politis Family Trust | -- | -- | |
| Anthony Politis Family Trust | -- | -- | |
| Politis Anthony G | -- | Salt Lake Title | |
| Kammerer Kelly D | -- | Salt Lake Title |
Source: Public Records
Mortgage History
| Date | Status | Borrower | Loan Amount |
|---|---|---|---|
| Previous Owner | Politis Anthony G | $34,875 | |
| Previous Owner | Politis Anthony G | $186,000 | |
| Previous Owner | Kammerer Kelly D | $163,886 |
Source: Public Records
Tax History
| Year | Tax Paid | Tax Assessment Tax Assessment Total Assessment is a certain percentage of the fair market value that is determined by local assessors to be the total taxable value of land and additions on the property. | Land | Improvement |
|---|---|---|---|---|
| 2025 | $2,720 | $467,000 | $168,700 | $298,300 |
| 2024 | $2,720 | $446,500 | $159,200 | $287,300 |
| 2023 | $2,591 | $421,600 | $151,300 | $270,300 |
| 2022 | $0 | $430,100 | $126,100 | $304,000 |
| 2021 | $3,165 | $327,300 | $116,400 | $210,900 |
| 2020 | $2,293 | $294,900 | $95,600 | $199,300 |
| 2019 | $2,197 | $275,200 | $90,200 | $185,000 |
| 2016 | $1,785 | $210,800 | $90,200 | $120,600 |
Source: Public Records
Map
Nearby Homes
- 512 E Larchwood Dr
- 6874 S 595 E Unit 66
- 283 E Vaughn Ln Unit 12
- 6717 S Vaughn Ln Unit 9
- 6715 S Vaughn Ln Unit 8
- 6718 S Vaughn Ln Unit 21
- 7033 S 300 E
- 6720 S Vaughn Ln Unit 20
- 6716 S Vaughn Ln Unit 22
- 6714 S Vaughn Ln Unit 23
- 7045 S 300 E
- 6969 S Free Land Ave
- 7187 S 420 E
- 6965 S 700 E
- 195 E 7060 S
- 7097 S 230 E
- 347 E Winchester St
- 7083 Village Place
- 529 E 7215 S Unit 9
- 7218 S Viansa Ct
Your Personal Tour Guide
Ask me questions while you tour the home.