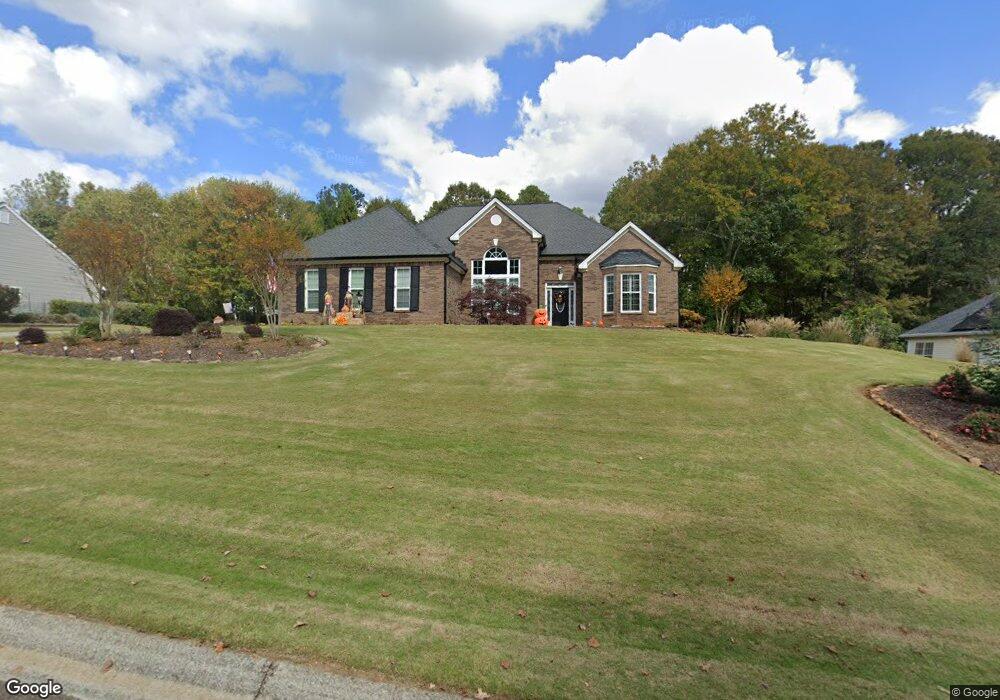
476 Gold Crest Dr Braselton, GA 30517
Estimated Value: $413,619 - $498,000
--
Bed
2
Baths
2,180
Sq Ft
$211/Sq Ft
Est. Value
About This Home
This home is located at 476 Gold Crest Dr, Braselton, GA 30517 and is currently estimated at $459,405, approximately $210 per square foot. 476 Gold Crest Dr is a home located in Jackson County with nearby schools including West Jackson Elementary School, West Jackson Middle School, and Jackson County High School.
Ownership History
Date
Name
Owned For
Owner Type
Purchase Details
Closed on
Sep 21, 2021
Sold by
Greeson Susan
Bought by
Greeson Susan and Greeson Philip W
Current Estimated Value
Home Financials for this Owner
Home Financials are based on the most recent Mortgage that was taken out on this home.
Original Mortgage
$147,100
Outstanding Balance
$111,540
Interest Rate
2.8%
Mortgage Type
New Conventional
Estimated Equity
$347,865
Purchase Details
Closed on
Apr 21, 2006
Sold by
Not Provided
Bought by
Whidby Susan
Home Financials for this Owner
Home Financials are based on the most recent Mortgage that was taken out on this home.
Original Mortgage
$205,520
Interest Rate
6.29%
Mortgage Type
New Conventional
Purchase Details
Closed on
Nov 9, 2001
Sold by
Cally Builders Inc
Bought by
Matseas Carol E
Purchase Details
Closed on
Dec 18, 2000
Sold by
Liberty Crest Prop
Bought by
Cally Builders Inc
Create a Home Valuation Report for This Property
The Home Valuation Report is an in-depth analysis detailing your home's value as well as a comparison with similar homes in the area
Home Values in the Area
Average Home Value in this Area
Purchase History
| Date | Buyer | Sale Price | Title Company |
|---|---|---|---|
| Greeson Susan | -- | -- | |
| Whidby Susan | $256,900 | -- | |
| Matseas Carol E | $182,900 | -- | |
| Cally Builders Inc | $87,500 | -- |
Source: Public Records
Mortgage History
| Date | Status | Borrower | Loan Amount |
|---|---|---|---|
| Open | Greeson Susan | $147,100 | |
| Previous Owner | Whidby Susan | $205,520 |
Source: Public Records
Tax History Compared to Growth
Tax History
| Year | Tax Paid | Tax Assessment Tax Assessment Total Assessment is a certain percentage of the fair market value that is determined by local assessors to be the total taxable value of land and additions on the property. | Land | Improvement |
|---|---|---|---|---|
| 2024 | $1,569 | $146,800 | $26,000 | $120,800 |
| 2023 | $3,072 | $132,880 | $26,000 | $106,880 |
| 2022 | $2,470 | $112,040 | $26,000 | $86,040 |
| 2021 | $2,206 | $102,840 | $16,800 | $86,040 |
| 2020 | $1,858 | $87,040 | $16,800 | $70,240 |
| 2019 | $1,938 | $88,600 | $16,800 | $71,800 |
| 2018 | $1,934 | $87,680 | $16,800 | $70,880 |
| 2017 | $1,859 | $85,241 | $16,800 | $68,441 |
| 2016 | $2,921 | $85,241 | $16,800 | $68,441 |
| 2015 | $2,579 | $75,148 | $10,800 | $64,348 |
| 2014 | $2,175 | $64,957 | $10,800 | $54,157 |
| 2013 | -- | $61,416 | $10,800 | $50,616 |
Source: Public Records
Map
Nearby Homes
- 606 Gold Crest Dr
- Ivy Plan at The Reserve At Liberty Park - Designer Collection
- Avery Plan at The Reserve At Liberty Park - Designer Collection
- Blair Plan at The Reserve At Liberty Park - Designer Collection
- Grandin Plan at The Reserve At Liberty Park - Designer Collection
- Wyatt Plan at The Reserve At Liberty Park - Designer Collection
- Linden Plan at The Reserve At Liberty Park - Designer Collection
- Charles Plan at The Reserve At Liberty Park - Designer Collection
- Calvin Plan at The Reserve At Liberty Park - Designer Collection
- 50 Linden Ct
- 1413 Liberty Park Dr
- 799 Gold Crest Dr
- 37 Linden Ct
- 60 Linden Ct
- 1590 Adams Ave
- 186 Catalpa Grove
- 1046 Madison Ave
- 201 Catalpa Grove
- 1740 Grant Ct
- 3041 Vista Ridge
- 450 Gold Crest Dr
- 494 Gold Crest Dr
- 430 Juniper Ct
- 457 Gold Crest Dr
- 440 Juniper Ct
- 424 Gold Crest Dr
- 520 Gold Crest Dr Unit 76
- 520 Gold Crest Dr
- 501 Gold Crest Dr
- 439 Juniper Ct
- 396 Gold Crest Rd
- 396 Gold Crest Dr
- 429 Juniper Ct
- 548 Gold Crest Rd
- 34 Venture Ct
- 548 Gold Crest Dr
- 419 Juniper Ct
- 391 Gold Crest Dr
- 420 New Liberty Church Rd
- 47 Nugget Trail