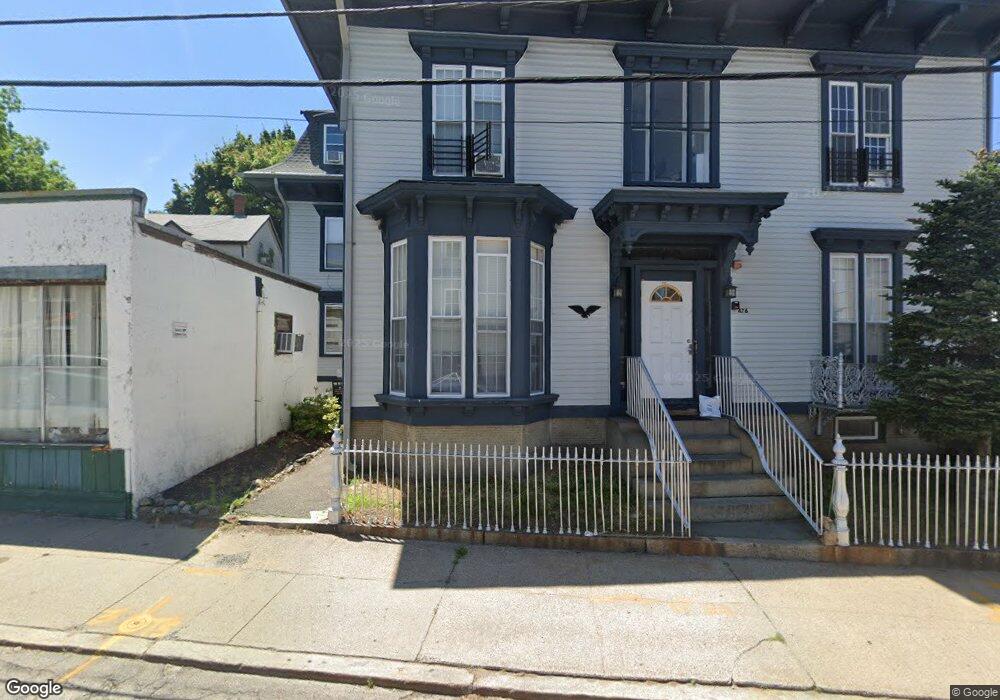
476 High St Unit 3 Central Falls, RI 02863
Estimated Value: $447,236
3
Beds
1
Bath
1,000
Sq Ft
$447/Sq Ft
Est. Value
About This Home
This home is located at 476 High St Unit 3, Central Falls, RI 02863 and is currently priced at $447,236, approximately $447 per square foot. 476 High St Unit 3 is a home located in Providence County with nearby schools including Central Falls Senior High School and Saint Raphael Academy.
Ownership History
Date
Name
Owned For
Owner Type
Purchase Details
Closed on
Aug 5, 2016
Sold by
Koziol Stanley P
Bought by
Jimenez Ely
Current Estimated Value
Home Financials for this Owner
Home Financials are based on the most recent Mortgage that was taken out on this home.
Original Mortgage
$172,000
Outstanding Balance
$137,589
Interest Rate
3.56%
Mortgage Type
Commercial
Purchase Details
Closed on
Apr 6, 2001
Sold by
Pianka Michelle
Bought by
Koziol Stanley P
Purchase Details
Closed on
Oct 5, 1998
Sold by
Resident Area Invest
Bought by
Pianka Michelle
Create a Home Valuation Report for This Property
The Home Valuation Report is an in-depth analysis detailing your home's value as well as a comparison with similar homes in the area
Home Values in the Area
Average Home Value in this Area
Purchase History
| Date | Buyer | Sale Price | Title Company |
|---|---|---|---|
| Jimenez Ely | $215,000 | -- | |
| Jimenez Ely | $215,000 | -- | |
| Koziol Stanley P | $135,000 | -- | |
| Koziol Stanley P | $135,000 | -- | |
| Pianka Michelle | $105,000 | -- | |
| Pianka Michelle | $105,000 | -- |
Source: Public Records
Mortgage History
| Date | Status | Borrower | Loan Amount |
|---|---|---|---|
| Open | Pianka Michelle | $172,000 | |
| Closed | Pianka Michelle | $172,000 |
Source: Public Records
Tax History
| Year | Tax Paid | Tax Assessment Tax Assessment Total Assessment is a certain percentage of the fair market value that is determined by local assessors to be the total taxable value of land and additions on the property. | Land | Improvement |
|---|---|---|---|---|
| 2025 | $9,481 | $717,700 | $76,600 | $641,100 |
| 2024 | $8,656 | $471,400 | $66,100 | $405,300 |
| 2023 | $8,656 | $471,400 | $66,100 | $405,300 |
| 2022 | $0 | $471,800 | $66,100 | $405,700 |
| 2021 | $8,656 | $364,300 | $72,100 | $292,200 |
| 2020 | $8,630 | $364,300 | $72,100 | $292,200 |
| 2019 | $11,437 | $461,900 | $72,100 | $389,800 |
| 2018 | $7,593 | $288,600 | $64,900 | $223,700 |
| 2017 | $7,593 | $288,600 | $64,900 | $223,700 |
| 2016 | $7,483 | $288,600 | $64,900 | $223,700 |
| 2015 | $7,234 | $261,800 | $64,900 | $196,900 |
| 2014 | $7,137 | $261,800 | $64,900 | $196,900 |
| 2013 | $6,733 | $261,800 | $64,900 | $196,900 |
Source: Public Records
Map
Nearby Homes
- 511 High St
- 517 High St
- 396 Roosevelt Ave
- 218 Central St
- 300 Front St Unit 409
- 7 Fales St
- 234 Central St Unit 236
- 256 High St
- 30 Foundry St Unit 6
- 78 Barton St
- 84 Barton St
- 35 Laurel St
- 57 Sylvian St
- 76 Sylvian St Unit 80
- 153 Central Ave
- 70 Lincoln Ave
- 140 Dexter St
- 152 Washington St
- 10 Exchange Ct Unit 203
- 48 Kossuth St
Your Personal Tour Guide
Ask me questions while you tour the home.