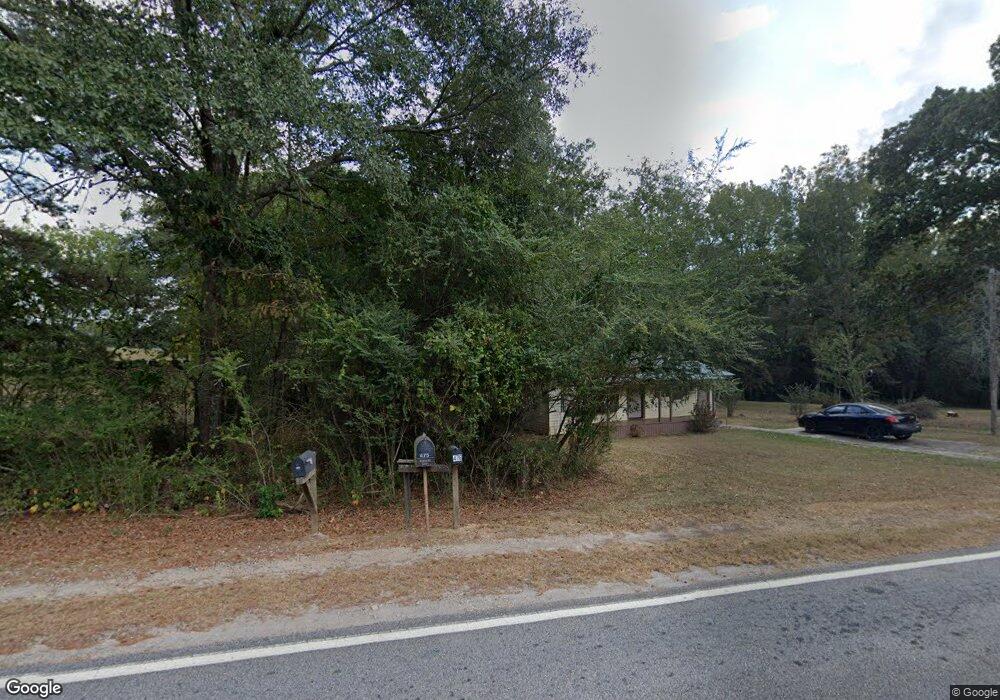
476 Piedmont Rd Barnesville, GA 30204
Estimated Value: $92,028 - $248,000
2
Beds
1
Bath
706
Sq Ft
$244/Sq Ft
Est. Value
About This Home
This home is located at 476 Piedmont Rd, Barnesville, GA 30204 and is currently estimated at $172,007, approximately $243 per square foot. 476 Piedmont Rd is a home located in Lamar County with nearby schools including Lamar County Primary School, Lamar County Elementary School, and Lamar County Middle School.
Ownership History
Date
Name
Owned For
Owner Type
Purchase Details
Closed on
Jul 21, 2016
Sold by
Micah B
Bought by
Torbert Scott
Current Estimated Value
Purchase Details
Closed on
May 24, 2011
Sold by
Southeastern Real Development Llc
Bought by
Lester Micah B
Home Financials for this Owner
Home Financials are based on the most recent Mortgage that was taken out on this home.
Original Mortgage
$8,891
Interest Rate
4.79%
Mortgage Type
New Conventional
Purchase Details
Closed on
Mar 2, 2010
Sold by
Lenhart Thomas E
Bought by
S E Real Development Ll
Purchase Details
Closed on
Jun 20, 2003
Sold by
Cherry William S and Cherry Kathlee
Bought by
Lenhart Thomas E
Purchase Details
Closed on
Feb 21, 2001
Sold by
Rollins Peter A
Bought by
Cherry William S and Cherry Kathl
Purchase Details
Closed on
Oct 29, 1999
Sold by
Amerson Eugene
Bought by
Rollins Peter A
Purchase Details
Closed on
Dec 2, 1994
Bought by
Amerson Eugene and Amerson Haz
Create a Home Valuation Report for This Property
The Home Valuation Report is an in-depth analysis detailing your home's value as well as a comparison with similar homes in the area
Home Values in the Area
Average Home Value in this Area
Purchase History
| Date | Buyer | Sale Price | Title Company |
|---|---|---|---|
| Torbert Scott | $20,000 | -- | |
| Lester Micah B | $10,000 | -- | |
| Lester Micah B | $10,000 | -- | |
| S E Real Development Ll | -- | -- | |
| Lenhart Thomas E | $43,200 | -- | |
| Cherry William S | $38,000 | -- | |
| Rollins Peter A | $28,900 | -- | |
| Amerson Eugene | $26,000 | -- |
Source: Public Records
Mortgage History
| Date | Status | Borrower | Loan Amount |
|---|---|---|---|
| Previous Owner | Lester Micah B | $8,891 |
Source: Public Records
Tax History Compared to Growth
Tax History
| Year | Tax Paid | Tax Assessment Tax Assessment Total Assessment is a certain percentage of the fair market value that is determined by local assessors to be the total taxable value of land and additions on the property. | Land | Improvement |
|---|---|---|---|---|
| 2025 | $567 | $27,108 | $10,560 | $16,548 |
| 2024 | $567 | $24,024 | $10,560 | $13,464 |
| 2023 | $603 | $23,742 | $10,560 | $13,182 |
| 2022 | $452 | $18,261 | $6,165 | $12,096 |
| 2021 | $418 | $15,811 | $6,165 | $9,646 |
| 2020 | $440 | $15,811 | $6,165 | $9,646 |
| 2019 | $441 | $15,811 | $6,165 | $9,646 |
| 2018 | $424 | $15,811 | $6,165 | $9,646 |
| 2017 | $406 | $15,811 | $6,165 | $9,646 |
| 2016 | $259 | $10,409 | $763 | $9,646 |
| 2015 | $255 | $10,410 | $763 | $9,646 |
| 2014 | $255 | $10,688 | $763 | $9,925 |
| 2013 | -- | $10,688 | $763 | $9,925 |
Source: Public Records
Map
Nearby Homes
- 0 Perkins Rd Unit 253616
- 0 Perkins Rd Unit 10625263
- 0 Perkins Rd Unit 7692755
- 0 Perkins Rd Unit 10635198
- 34.61 ACRES Walker Rd
- 254 Needleleaf Dr
- 967 Five Points Rd
- 746 Highway 18 W
- 818 Cannafax Rd
- 144 Berry Rd
- 150 Berry Rd
- 146 Berry Rd
- 148 Berry Rd
- 1440 McCard Lake Rd
- 0 Piedmont Rd Unit 10600733
- 725 Mccollum Rd
- 0 Washington Cir
- 0 Billies Way Unit 10435066
- 178 Barnesville Ave
- 63 Alabama Rd
- 518 Piedmont Rd
- 482 Piedmont Rd
- 473 Piedmont Rd
- 489 Piedmont Rd
- 524 Piedmont Rd
- 520 Piedmont Rd
- 447 Piedmont Rd
- 475 Piedmont Rd
- 436 Piedmont Rd
- 436 Piedmont Rd
- 507 Piedmont Rd
- 424 Piedmont Rd
- 523 Piedmont Rd
- 550 Piedmont Rd
- 601 Piedmont Rd
- 599 Piedmont Rd
- 412 Piedmont Rd
- 541 Piedmont Rd
- 566 Piedmont Rd
- 555 Piedmont Rd