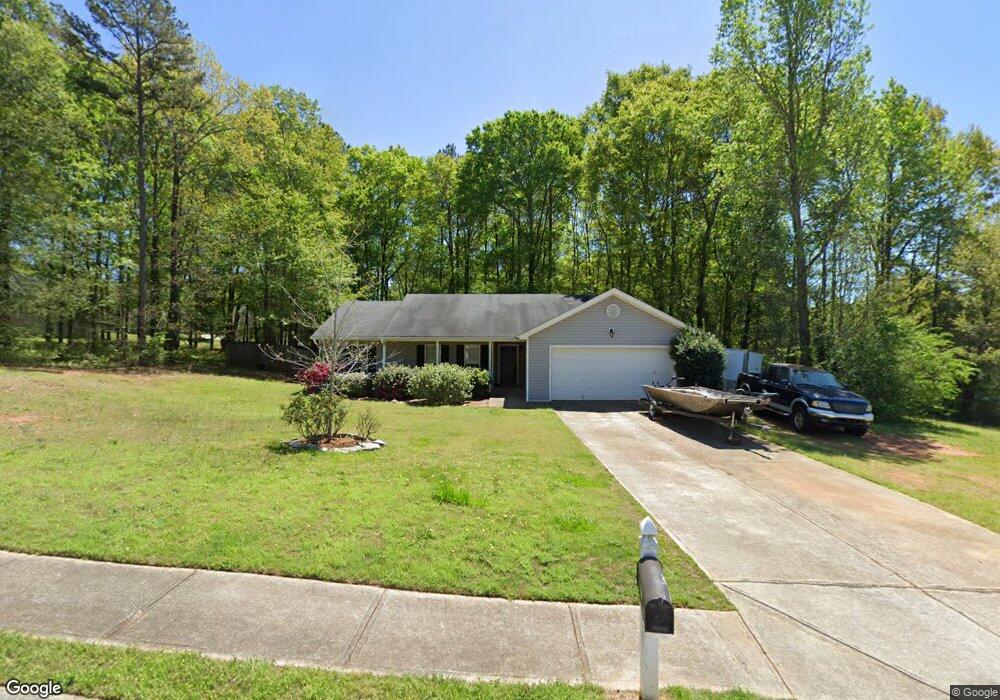
476 Raider Way Bethlehem, GA 30620
Estimated Value: $281,000 - $321,000
Studio
2
Baths
1,355
Sq Ft
$221/Sq Ft
Est. Value
About This Home
This home is located at 476 Raider Way, Bethlehem, GA 30620 and is currently estimated at $299,476, approximately $221 per square foot. 476 Raider Way is a home located in Barrow County with nearby schools including Bethlehem Elementary School, Haymon-Morris Middle School, and Apalachee High School.
Ownership History
Date
Name
Owned For
Owner Type
Purchase Details
Closed on
May 9, 2024
Sold by
Carter Kayla
Bought by
Russell Jonathan M
Current Estimated Value
Home Financials for this Owner
Home Financials are based on the most recent Mortgage that was taken out on this home.
Original Mortgage
$101,800
Outstanding Balance
$95,076
Interest Rate
6.44%
Mortgage Type
New Conventional
Estimated Equity
$204,400
Purchase Details
Closed on
Aug 28, 2007
Sold by
Southfork Hms Inc
Bought by
Russell Jonathan M and Carter Kayla
Home Financials for this Owner
Home Financials are based on the most recent Mortgage that was taken out on this home.
Original Mortgage
$137,072
Interest Rate
6.65%
Mortgage Type
FHA
Purchase Details
Closed on
Nov 22, 2006
Sold by
Ansley Estates Llc
Bought by
Southfork Homes Inc
Purchase Details
Closed on
May 12, 2005
Sold by
See Sellers In Comments
Bought by
Ansley Estates Llc
Create a Home Valuation Report for This Property
The Home Valuation Report is an in-depth analysis detailing your home's value as well as a comparison with similar homes in the area
Home Values in the Area
Average Home Value in this Area
Purchase History
| Date | Buyer | Sale Price | Title Company |
|---|---|---|---|
| Russell Jonathan M | -- | -- | |
| Russell Jonathan M | $138,200 | -- | |
| Southfork Homes Inc | $36,500 | -- | |
| Ansley Estates Llc | -- | -- |
Source: Public Records
Mortgage History
| Date | Status | Borrower | Loan Amount |
|---|---|---|---|
| Open | Russell Jonathan M | $101,800 | |
| Previous Owner | Russell Jonathan M | $137,072 |
Source: Public Records
Tax History
| Year | Tax Paid | Tax Assessment Tax Assessment Total Assessment is a certain percentage of the fair market value that is determined by local assessors to be the total taxable value of land and additions on the property. | Land | Improvement |
|---|---|---|---|---|
| 2025 | $2,580 | $106,811 | $22,800 | $84,011 |
| 2024 | $2,565 | $104,368 | $22,800 | $81,568 |
| 2023 | $2,943 | $104,768 | $22,800 | $81,968 |
| 2022 | $2,247 | $79,442 | $22,800 | $56,642 |
| 2021 | $1,788 | $59,942 | $16,000 | $43,942 |
| 2020 | $1,733 | $58,128 | $16,000 | $42,128 |
| 2019 | $1,762 | $58,128 | $16,000 | $42,128 |
| 2018 | $1,666 | $55,742 | $11,800 | $43,942 |
| 2017 | $1,339 | $46,001 | $11,800 | $34,201 |
| 2016 | $1,167 | $40,435 | $11,800 | $28,635 |
| 2015 | $1,181 | $40,738 | $11,800 | $28,938 |
| 2014 | $1,055 | $36,396 | $7,154 | $29,242 |
| 2013 | -- | $34,659 | $7,154 | $27,505 |
Source: Public Records
Map
Nearby Homes
- 480 Raider Way
- 461 Tanners Bridge Cir Unit 3
- 457 Tanners Bridge Cir Unit 4
- 154 Blissful Ln
- 476 Tanners Bridge Cir Unit 1
- 0 Tanners Bridge Cir Unit 10536031
- 3243 Lowell Rd
- 3233 Lowell Rd
- 3283 Lowell Rd
- 404 Tanners Bridge Rd
- 3680 Apalachee Ridge
- 760 Carl Davis Rd
- 760 Carl Davis Rd NW
- 3757 Lower Tanners Bridge Rd
- 1071 Covenant Ct
- 454 Grant Ct
- 431 Providence Club Dr
- 3589 Fannie Thompson Rd NW
- 3601 Fannie Thompson Rd NW
- 3625 Fannie Thompson Rd NW
- 479 Raider Way
- 477 Raider Way
- 475 Raider Way
- 481 Raider Way
- 359 Centennial Dr
- 357 Centennial Dr Unit 31
- 357 Centennial Dr
- 473 Raider Way
- 361 Centennial Dr Unit 1
- 361 Centennial Dr
- 363 Centennial Dr Unit 1
- 363 Centennial Dr
- 353 Centennial Dr
- 482 Raider Way
- 351 Centennial Dr
- 362 Centennial Dr
- 356 Centennial Dr
- 367 Centennial Drive (Lot36)
- 367 Centennial Dr
- 364 Centennial Dr Unit 44
Your Personal Tour Guide
Ask me questions while you tour the home.