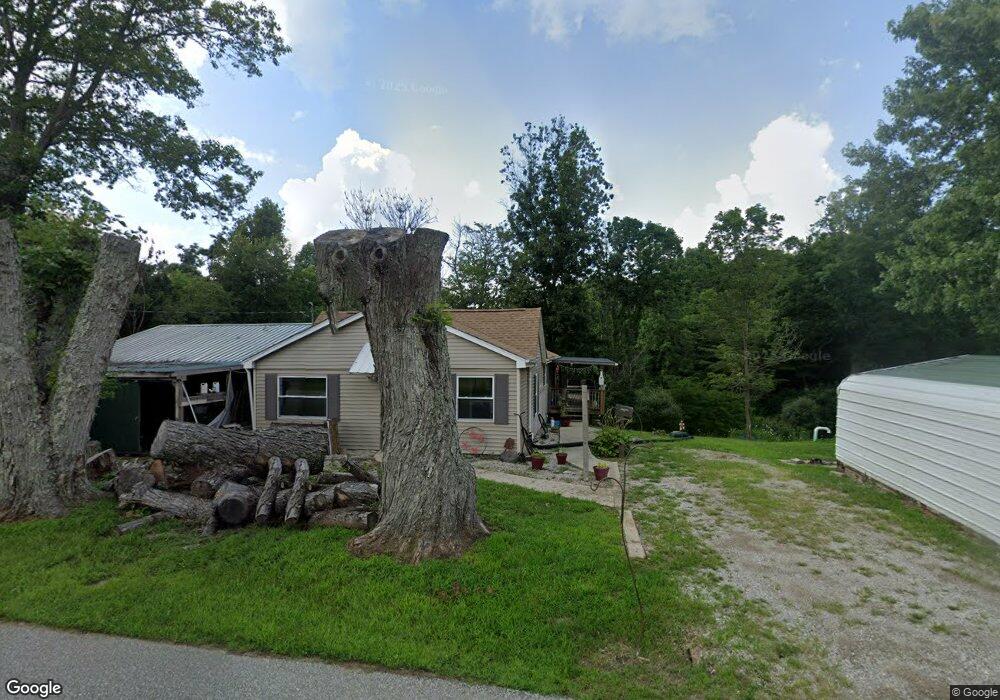
4760 Peoga Rd Trafalgar, IN 46181
Estimated Value: $142,137 - $240,000
2
Beds
1
Bath
1,008
Sq Ft
$170/Sq Ft
Est. Value
About This Home
This home is located at 4760 Peoga Rd, Trafalgar, IN 46181 and is currently estimated at $171,784, approximately $170 per square foot. 4760 Peoga Rd is a home located in Brown County with nearby schools including Brown County High School.
Ownership History
Date
Name
Owned For
Owner Type
Purchase Details
Closed on
Dec 2, 2022
Sold by
Burton Tara
Bought by
Burton Max
Current Estimated Value
Purchase Details
Closed on
Nov 21, 2020
Sold by
Poole Ladean and Poole Alice
Bought by
Burton Max and Burton Tara
Purchase Details
Closed on
Nov 17, 2010
Sold by
Fannie Mae
Bought by
Poole Ladean and Poole Alice
Purchase Details
Closed on
Jun 30, 2010
Sold by
Sanders Michael W and Hensley Mary J
Bought by
Federal National Mortgage Association
Purchase Details
Closed on
Mar 1, 2007
Sold by
Jackson Alphonso
Bought by
Sanders Michael W and Hensley Mary J
Home Financials for this Owner
Home Financials are based on the most recent Mortgage that was taken out on this home.
Original Mortgage
$58,510
Interest Rate
6.4%
Purchase Details
Closed on
Jul 21, 2006
Sold by
Mers Inc
Bought by
The Secretary Of Housing And Urban Devel
Purchase Details
Closed on
Jul 12, 2006
Sold by
Anderson Steven and Anderson Jennifer
Bought by
Mers Inc
Create a Home Valuation Report for This Property
The Home Valuation Report is an in-depth analysis detailing your home's value as well as a comparison with similar homes in the area
Home Values in the Area
Average Home Value in this Area
Purchase History
| Date | Buyer | Sale Price | Title Company |
|---|---|---|---|
| Burton Max | -- | None Listed On Document | |
| Burton Max | $90,000 | Denali Title And Esctow Agency | |
| Poole Ladean | -- | -- | |
| Federal National Mortgage Association | $44,300 | -- | |
| Sanders Michael W | -- | -- | |
| The Secretary Of Housing And Urban Devel | -- | -- | |
| Mers Inc | $137,600 | -- |
Source: Public Records
Mortgage History
| Date | Status | Borrower | Loan Amount |
|---|---|---|---|
| Previous Owner | Sanders Michael W | $58,510 |
Source: Public Records
Tax History Compared to Growth
Tax History
| Year | Tax Paid | Tax Assessment Tax Assessment Total Assessment is a certain percentage of the fair market value that is determined by local assessors to be the total taxable value of land and additions on the property. | Land | Improvement |
|---|---|---|---|---|
| 2024 | $291 | $134,100 | $46,300 | $87,800 |
| 2023 | $273 | $122,400 | $40,900 | $81,500 |
| 2022 | $267 | $111,100 | $30,900 | $80,200 |
| 2021 | $221 | $96,300 | $25,900 | $70,400 |
| 2020 | $387 | $77,800 | $13,400 | $64,400 |
| 2019 | $387 | $72,600 | $13,400 | $59,200 |
| 2018 | $430 | $71,300 | $13,400 | $57,900 |
| 2017 | $360 | $65,900 | $13,400 | $52,500 |
| 2016 | $792 | $64,700 | $13,400 | $51,300 |
| 2014 | $540 | $51,400 | $13,400 | $38,000 |
| 2013 | $540 | $50,600 | $13,400 | $37,200 |
Source: Public Records
Map
Nearby Homes
- 8191 S Bayview Ct
- 8048 S Indian Ridge Dr
- 4465 W Grouse Dr
- 7899 S Timber Cliff Ln
- 8942 Bean Blossom Rd
- 6968 S 300 W
- 2283 W Indian Creek Rd
- 1828 W 750 S
- 7953 Ford Ridge Rd
- 969 W Bauer Dr
- 952 W Kamleifer Dr
- 6323 Antelope Dr
- 1267 W 750 S
- 2508 W Indian Creek Rd
- 756 W Brown Lake Dr
- 915 W Lakeview Dr
- 8460 S Green Dr
- 6129 Flamingo Dr
- 6141 Flamingo Dr
- 6427 Buffalo Dr