Estimated Value: $420,757 - $450,000
3
Beds
4
Baths
2,429
Sq Ft
$178/Sq Ft
Est. Value
About This Home
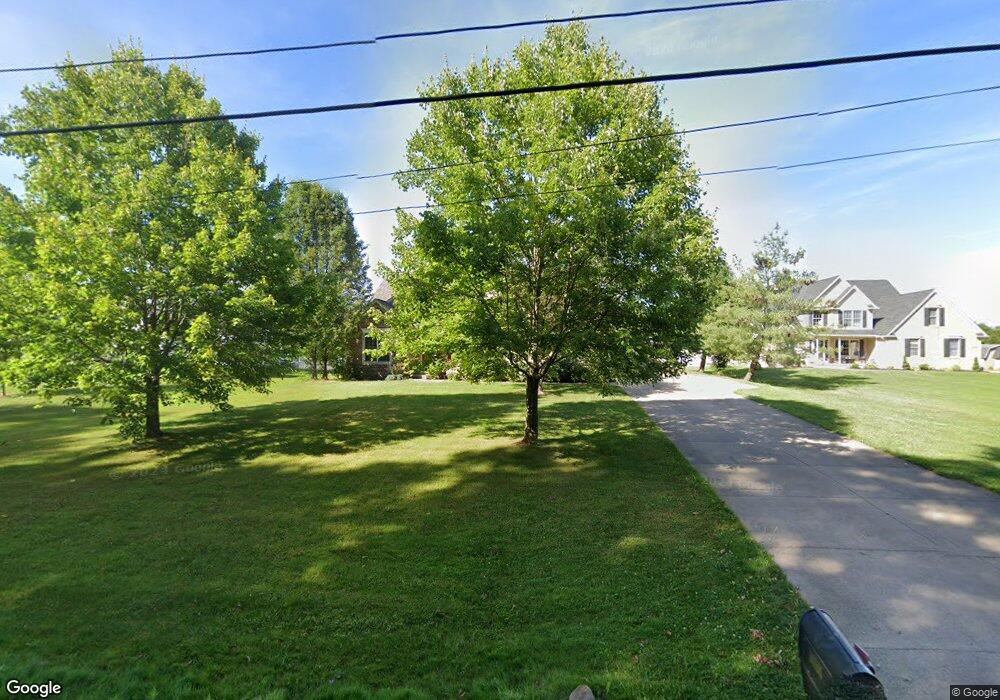
This home is located at 4760 Sherman Rd, Kent, OH 44240 and is currently estimated at $432,689, approximately $178 per square foot. 4760 Sherman Rd is a home located in Portage County with nearby schools including Brimfield Elementary School, Field Middle School, and Field High School.
Ownership History
Date
Name
Owned For
Owner Type
Purchase Details
Closed on
Aug 26, 2015
Sold by
Morgan Alan R and Morgan Kathy
Bought by
Bennett Richard A and Bennett Rebecca J
Current Estimated Value
Home Financials for this Owner
Home Financials are based on the most recent Mortgage that was taken out on this home.
Original Mortgage
$262,057
Outstanding Balance
$208,187
Interest Rate
4.25%
Mortgage Type
FHA
Estimated Equity
$224,502
Purchase Details
Closed on
Mar 23, 2004
Sold by
King Moss Llc
Bought by
Morgan Alan R and Morgan Kathy
Home Financials for this Owner
Home Financials are based on the most recent Mortgage that was taken out on this home.
Original Mortgage
$214,916
Interest Rate
3.62%
Mortgage Type
Purchase Money Mortgage
Purchase Details
Closed on
Mar 30, 2000
Sold by
Dallmann Dean and Dallmann Lynnette B
Bought by
Reserve Construction Inc
Create a Home Valuation Report for This Property
The Home Valuation Report is an in-depth analysis detailing your home's value as well as a comparison with similar homes in the area
Home Values in the Area
Average Home Value in this Area
Purchase History
| Date | Buyer | Sale Price | Title Company |
|---|---|---|---|
| Bennett Richard A | $269,150 | Revere Title | |
| Morgan Alan R | $51,900 | -- | |
| Reserve Construction Inc | $2,000 | -- |
Source: Public Records
Mortgage History
| Date | Status | Borrower | Loan Amount |
|---|---|---|---|
| Open | Bennett Richard A | $262,057 | |
| Closed | Morgan Alan R | $214,916 |
Source: Public Records
Tax History Compared to Growth
Tax History
| Year | Tax Paid | Tax Assessment Tax Assessment Total Assessment is a certain percentage of the fair market value that is determined by local assessors to be the total taxable value of land and additions on the property. | Land | Improvement |
|---|---|---|---|---|
| 2024 | $5,997 | $126,980 | $15,750 | $111,230 |
| 2023 | $5,671 | $96,670 | $15,750 | $80,920 |
| 2022 | $5,688 | $96,670 | $15,750 | $80,920 |
| 2021 | $5,556 | $96,670 | $15,750 | $80,920 |
| 2020 | $5,576 | $87,360 | $15,750 | $71,610 |
| 2019 | $5,493 | $87,360 | $15,750 | $71,610 |
| 2018 | $4,077 | $76,200 | $14,000 | $62,200 |
| 2017 | $4,077 | $76,200 | $14,000 | $62,200 |
| 2016 | $4,051 | $76,200 | $14,000 | $62,200 |
| 2015 | $3,020 | $76,200 | $14,000 | $62,200 |
| 2014 | $2,914 | $76,200 | $14,000 | $62,200 |
| 2013 | $3,267 | $76,200 | $14,000 | $62,200 |
Source: Public Records
Map
Nearby Homes
- 4837 King Meadow Trail
- 1755 Honeychuck Ln
- 4891 Edson Rd
- 1354 Brimfield Dr
- 4682 State Route 43
- Poplar Plan at Woodland Reserve
- Nassau Cove Plan at Woodland Reserve
- 0 Meloy Rd Unit 5162435
- V/L Sherman Rd
- 2092 Sugar Maple Dr
- 5123 Troyer Dr
- 2105 Sugar Maple Dr
- 1024E Cedar Ridge Dr
- 1024A Cedar Ridge Dr
- 2182 Sugar Maple Dr
- 1224 Cedar Ridge Rd
- 1236 Cedar Ridge Rd
- 5205 Cline Rd Unit A
- 1523 Whitehall Blvd
- 720 Ivan Dr
- 4758 Sherman Rd
- 4762 Sherman Rd
- 4764 Sherman Rd
- 4746 Sherman Rd
- 4690 Gate Post Ln
- 4768 Sherman Rd
- 4747 Sherman Rd
- 4732 Sherman Rd
- 4708 Gate Post Ln
- 4763 Sherman Rd
- 4776 Sherman Rd
- 4697 Gate Post Ln
- 4722 Gate Post Ln
- 4707 Gate Post Ln
- 4780 Sherman Rd
- 4718 Sherman Rd
- 4727 Sherman Rd
- 4731 King Meadow Trail
- 4717 Gate Post Ln
- 4740 Gate Post Ln