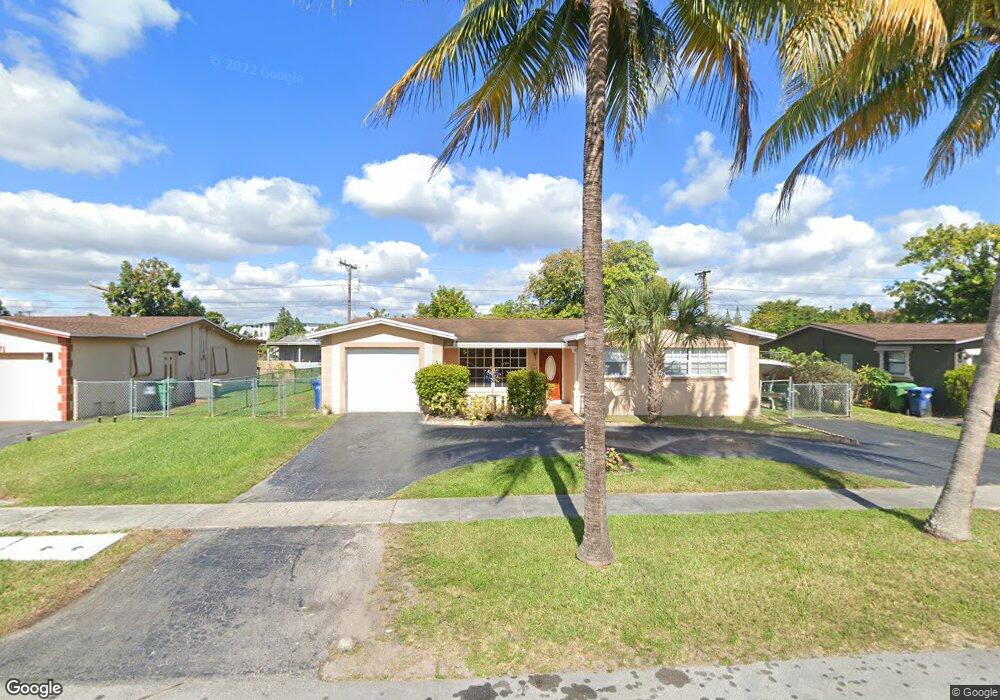
4761 NW 19th Ct Lauderhill, FL 33313
Estimated Value: $405,458 - $447,000
2
Beds
2
Baths
1,490
Sq Ft
$285/Sq Ft
Est. Value
About This Home
This home is located at 4761 NW 19th Ct, Lauderhill, FL 33313 and is currently estimated at $425,115, approximately $285 per square foot. 4761 NW 19th Ct is a home located in Broward County with nearby schools including Castle Hill Elementary School, Lauderhill 6-12, and Boyd H. Anderson High School.
Ownership History
Date
Name
Owned For
Owner Type
Purchase Details
Closed on
Feb 12, 2002
Sold by
Hud
Bought by
Hercules John Robert
Current Estimated Value
Home Financials for this Owner
Home Financials are based on the most recent Mortgage that was taken out on this home.
Original Mortgage
$76,800
Outstanding Balance
$31,576
Interest Rate
6.98%
Estimated Equity
$393,539
Purchase Details
Closed on
Dec 12, 2001
Sold by
Homeside Lending Inc
Bought by
Hud
Purchase Details
Closed on
Aug 13, 2001
Sold by
Available Not
Bought by
Available Not
Purchase Details
Closed on
Nov 20, 1997
Sold by
Dyce Dolphy B Armstrong
Bought by
Hall Stanley
Home Financials for this Owner
Home Financials are based on the most recent Mortgage that was taken out on this home.
Original Mortgage
$89,560
Interest Rate
7.27%
Mortgage Type
FHA
Purchase Details
Closed on
Nov 15, 1995
Sold by
Dyce Dolphy B Armstrong
Bought by
Armstrong Dyce Dolphy B and Henry Angela M
Create a Home Valuation Report for This Property
The Home Valuation Report is an in-depth analysis detailing your home's value as well as a comparison with similar homes in the area
Home Values in the Area
Average Home Value in this Area
Purchase History
| Date | Buyer | Sale Price | Title Company |
|---|---|---|---|
| Hercules John Robert | $96,000 | Lawyers Advantage Title Grp | |
| Hud | -- | -- | |
| Available Not | $10,000 | -- | |
| Hall Stanley | $88,900 | -- | |
| Armstrong Dyce Dolphy B | $100 | -- |
Source: Public Records
Mortgage History
| Date | Status | Borrower | Loan Amount |
|---|---|---|---|
| Open | Hercules John Robert | $76,800 | |
| Previous Owner | Armstrong Dyce Dolphy B | $89,560 |
Source: Public Records
Tax History Compared to Growth
Tax History
| Year | Tax Paid | Tax Assessment Tax Assessment Total Assessment is a certain percentage of the fair market value that is determined by local assessors to be the total taxable value of land and additions on the property. | Land | Improvement |
|---|---|---|---|---|
| 2025 | $1,769 | $93,220 | -- | -- |
| 2024 | $1,656 | $90,600 | -- | -- |
| 2023 | $1,656 | $87,970 | $0 | $0 |
| 2022 | $1,545 | $85,410 | $0 | $0 |
| 2021 | $1,530 | $82,930 | $0 | $0 |
| 2020 | $1,472 | $81,790 | $0 | $0 |
| 2019 | $1,408 | $79,960 | $0 | $0 |
| 2018 | $1,329 | $78,470 | $0 | $0 |
| 2017 | $1,263 | $76,860 | $0 | $0 |
| 2016 | $1,202 | $75,280 | $0 | $0 |
| 2015 | $1,218 | $74,760 | $0 | $0 |
| 2014 | $1,176 | $74,170 | $0 | $0 |
| 2013 | -- | $73,080 | $21,200 | $51,880 |
Source: Public Records
Map
Nearby Homes
- 4781 NW 19th Ct
- 4771 NW 20th St
- 4841 NW 19th Ct
- 4711 NW 19th Ct
- 4770 NW 21st St Unit 405
- 4740 NW 21st St Unit 207
- 4740 NW 21st St Unit 306
- 4740 NW 21st St Unit 309
- 4740 NW 21st St Unit 101
- 4740 NW 21st St Unit 211
- 2060 NW 48th Terrace Unit 101
- 2061 NW 47th Terrace Unit 212
- 2061 NW 47th Terrace Unit 407
- 2061 NW 47th Terrace Unit 414
- 2061 NW 47th Terrace Unit 103
- 2061 NW 47th Terrace Unit 405
- 4851 NW 21st St Unit 512
- 4851 NW 21st St Unit 109
- 4851 NW 21st St Unit 2P
- 4851 NW 21st St Unit 105
- 4751 NW 19th Ct
- 4771 NW 19th Ct
- 4760 NW 20th St
- 4770 NW 20th St
- 4750 NW 20th St
- 4741 NW 19th Ct
- 4780 NW 20th St
- 4760 NW 19th Ct
- 4750 NW 19th Ct
- 4770 NW 19th Ct
- 4740 NW 20th St
- 4740 NW 19th Ct
- 4790 NW 20th St
- 4801 NW 19th Ct
- 4731 NW 19th Ct
- 4800 NW 19th Ct
- 4730 NW 19th Ct
- 4761 NW 19th St
- 4761 NW 20th St
- 4730 NW 20th St