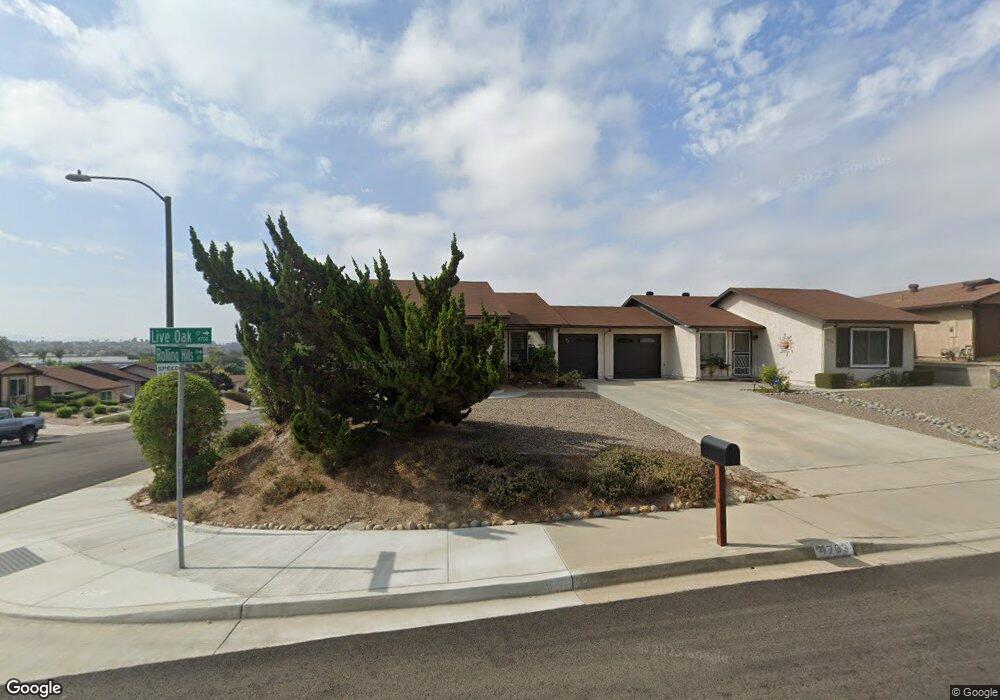
4763 Live Oak Ct Oceanside, CA 92056
Peacock NeighborhoodEstimated Value: $486,000 - $550,000
2
Beds
1
Bath
834
Sq Ft
$624/Sq Ft
Est. Value
About This Home
This home is located at 4763 Live Oak Ct, Oceanside, CA 92056 and is currently estimated at $520,578, approximately $624 per square foot. 4763 Live Oak Ct is a home located in San Diego County with nearby schools including T.H.E Leadership Academy, Roosevelt Middle School, and Vista High School.
Ownership History
Date
Name
Owned For
Owner Type
Purchase Details
Closed on
Jun 11, 2007
Sold by
Ewer Catherine S
Bought by
Ewer Catherine S
Current Estimated Value
Purchase Details
Closed on
Jun 30, 2006
Sold by
Matthews Charles E
Bought by
Ewer Catherine S
Home Financials for this Owner
Home Financials are based on the most recent Mortgage that was taken out on this home.
Original Mortgage
$190,000
Interest Rate
1%
Mortgage Type
Negative Amortization
Create a Home Valuation Report for This Property
The Home Valuation Report is an in-depth analysis detailing your home's value as well as a comparison with similar homes in the area
Home Values in the Area
Average Home Value in this Area
Purchase History
| Date | Buyer | Sale Price | Title Company |
|---|---|---|---|
| Ewer Catherine S | -- | None Available | |
| Ewer Catherine S | $239,000 | Diversified Title |
Source: Public Records
Mortgage History
| Date | Status | Borrower | Loan Amount |
|---|---|---|---|
| Closed | Ewer Catherine S | $190,000 |
Source: Public Records
Tax History
| Year | Tax Paid | Tax Assessment Tax Assessment Total Assessment is a certain percentage of the fair market value that is determined by local assessors to be the total taxable value of land and additions on the property. | Land | Improvement |
|---|---|---|---|---|
| 2025 | $2,706 | $254,806 | $64,413 | $190,393 |
| 2024 | $2,706 | $249,810 | $63,150 | $186,660 |
| 2023 | $2,640 | $244,912 | $61,912 | $183,000 |
| 2022 | $2,632 | $240,111 | $60,699 | $179,412 |
| 2021 | $2,572 | $235,404 | $59,509 | $175,895 |
| 2020 | $2,563 | $232,991 | $58,899 | $174,092 |
| 2019 | $2,524 | $228,424 | $57,745 | $170,679 |
| 2018 | $2,400 | $223,946 | $56,613 | $167,333 |
| 2017 | $70 | $219,555 | $55,503 | $164,052 |
| 2016 | $2,190 | $205,251 | $54,415 | $150,836 |
| 2015 | $2,181 | $202,169 | $53,598 | $148,571 |
| 2014 | $1,930 | $180,000 | $90,000 | $90,000 |
Source: Public Records
Map
Nearby Homes
- 1540 Highridge Dr
- 1521 Temple Heights Dr
- 1523 Temple Heights Dr
- 4734 Rim Rock Rd
- 1413 Panorama Ridge Rd
- 4699 Mystik Rd
- 1423 Mountain Meadow Dr
- 1400 Darwin Dr
- 4558 Golden Ridge Dr
- 4538 Sunrise Ridge
- 1376 Darwin Dr
- 1702 Havenwood Dr Unit 1702
- 4530 Beverly Glen Dr
- 475 Taylor Dr
- 1433 Grey Oaks Ct
- 1549 Fig Tree Way
- 1515 Fig Tree Way
- 4517 Quailridge Dr
- 1826 Via Quinto
- 1508 Laurelwood Way
- 4759 Live Oak Ct
- 4755 Live Oak Ct
- 4754 Canterbury Ct
- 4751 Live Oak Ct
- 1510 Rolling Hills Dr Unit 2
- 1506 Rolling Hills Dr
- 4752 Canterbury Ct
- 1502 Rolling Hills Dr
- 4750 Canterbury Ct
- 1516 Rolling Hills Dr
- 4747 Live Oak Ct
- 1432 Rolling Hills Dr
- 4756 Live Oak Ct
- 4760 Live Oak Ct Unit 2
- 1518 Rolling Hills Dr
- 4748 Canterbury Ct
- 4746 Canterbury Ct
- 1428 Rolling Hills Dr
- 4752 Live Oak Ct
- 4743 Live Oak Ct
Your Personal Tour Guide
Ask me questions while you tour the home.