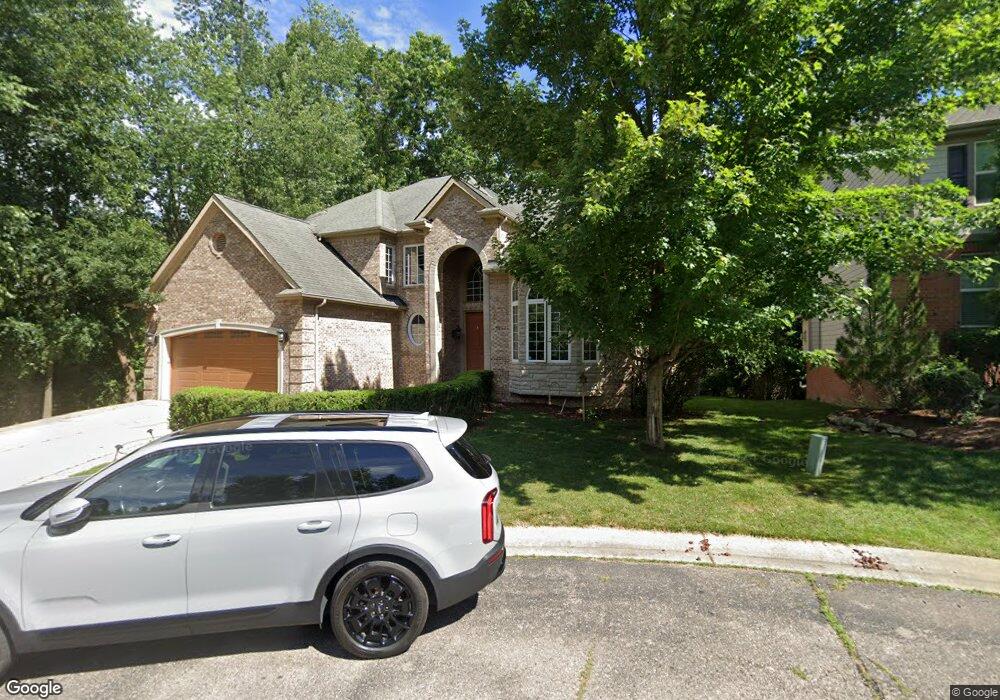
4763 Oak Grove Ct Unit Bldg-Unit West Bloomfield, MI 48323
Estimated Value: $720,000 - $786,000
5
Beds
4
Baths
2,853
Sq Ft
$264/Sq Ft
Est. Value
About This Home
This home is located at 4763 Oak Grove Ct Unit Bldg-Unit, West Bloomfield, MI 48323 and is currently estimated at $753,329, approximately $264 per square foot. 4763 Oak Grove Ct Unit Bldg-Unit is a home located in Oakland County with nearby schools including Walled Lake Central High School, The Susan And Rabbi Harold Loss Ecc, and Brookfield Academy - West Bloomfield.
Ownership History
Date
Name
Owned For
Owner Type
Purchase Details
Closed on
Jul 28, 2020
Sold by
Helfman Doron S and Helfman Julia
Bought by
Sanville Olivia
Current Estimated Value
Purchase Details
Closed on
Dec 9, 2005
Sold by
Kalabat Construction Inc
Bought by
Helfman Doron S and Helfman Julia
Purchase Details
Closed on
Aug 6, 2003
Sold by
Imp
Bought by
Kalabat Construction Inc
Create a Home Valuation Report for This Property
The Home Valuation Report is an in-depth analysis detailing your home's value as well as a comparison with similar homes in the area
Home Values in the Area
Average Home Value in this Area
Purchase History
| Date | Buyer | Sale Price | Title Company |
|---|---|---|---|
| Sanville Olivia | $524,000 | First American Title Ins Co | |
| Helfman Doron S | $124,153 | Philip R Seaver Title Co Inc | |
| Kalabat Construction Inc | $115,000 | -- |
Source: Public Records
Tax History Compared to Growth
Tax History
| Year | Tax Paid | Tax Assessment Tax Assessment Total Assessment is a certain percentage of the fair market value that is determined by local assessors to be the total taxable value of land and additions on the property. | Land | Improvement |
|---|---|---|---|---|
| 2024 | $5,612 | $303,980 | $0 | $0 |
| 2022 | $5,291 | $274,790 | $32,500 | $242,290 |
| 2021 | $13,143 | $259,110 | $0 | $0 |
| 2020 | $4,253 | $257,110 | $32,500 | $224,610 |
| 2018 | $6,896 | $242,130 | $32,500 | $209,630 |
| 2015 | -- | $220,430 | $0 | $0 |
| 2014 | -- | $200,240 | $0 | $0 |
| 2011 | -- | $178,310 | $0 | $0 |
Source: Public Records
Map
Nearby Homes
- 5994 Glen Eagles Dr
- 4540 Rolling Pine Ct
- 6140 Pontiac Trail
- 000 Pontiac Trail
- 6100 Pontiac Trail
- 7545/7585 Pontiac Trail
- 7585/7548 Pontiac Trail
- 6433 Walnut Lake Rd
- 4442 Borland St
- 6980 Hambro St
- 6675 Langtoft St
- 0000 Langtoft
- 4066 Green Lake Rd
- 6606 Leytonstone Blvd
- VL Leytonstone Blvd
- 7065 Deerwood Trail Unit 27
- 5676 Hillcrest Cir E
- 5608 Hillcrest Cir W Unit 80
- 4335 Crestdale Ave
- 3950 Bradmore Ave
- 4763 Oak Grove Ct
- 6300 Wimbley Ln
- 4762 Oak Grove Ct Unit 8
- 6320 Wimbley Ln
- 4756 Oak Grove Ct Unit 7
- 4750 Oak Grove Ct Unit 6
- 6360 Wimbley Ln
- 4759 Woodbine Cir
- 4744 Oak Grove Ct Unit 5
- 6301 Wimbley Ln
- 4753 Woodbine Cir Unit 8
- 4765 Woodbine Cir
- 4747 Woodbine Cir
- 6353 Country Shire Ln
- 6400 Wimbley Ln
- 6366 Country Shire Ln
- 6378 Country Shire Ln
- 6365 Country Shire Ln Unit 10
- 4741 Woodbine Cir
- 6345 Wimbley Ln