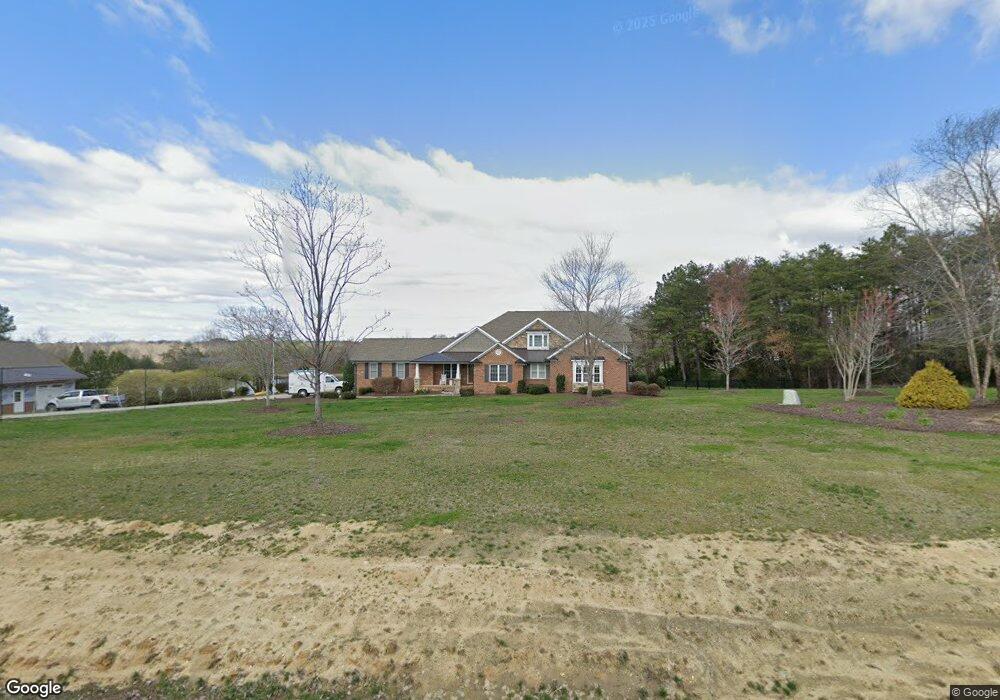
4764 Lowder Rd Burlington, NC 27217
Estimated Value: $280,000 - $846,000
3
Beds
4
Baths
4,340
Sq Ft
$140/Sq Ft
Est. Value
About This Home
This home is located at 4764 Lowder Rd, Burlington, NC 27217 and is currently estimated at $606,902, approximately $139 per square foot. 4764 Lowder Rd is a home located in Alamance County with nearby schools including Altamahaw Ossipee Elementary School, Woodlawn Middle School, and Eastern Alamance High School.
Ownership History
Date
Name
Owned For
Owner Type
Purchase Details
Closed on
Sep 26, 2016
Sold by
Hilliard Henry F
Bought by
Collins John William and Collins Rachel Hilliard
Current Estimated Value
Purchase Details
Closed on
Nov 2, 2006
Sold by
Hilliard Henry F
Bought by
Collins John W
Home Financials for this Owner
Home Financials are based on the most recent Mortgage that was taken out on this home.
Original Mortgage
$140,800
Interest Rate
6.31%
Mortgage Type
New Conventional
Create a Home Valuation Report for This Property
The Home Valuation Report is an in-depth analysis detailing your home's value as well as a comparison with similar homes in the area
Home Values in the Area
Average Home Value in this Area
Purchase History
| Date | Buyer | Sale Price | Title Company |
|---|---|---|---|
| Collins John William | -- | None Available | |
| Collins John W | $176,000 | -- |
Source: Public Records
Mortgage History
| Date | Status | Borrower | Loan Amount |
|---|---|---|---|
| Previous Owner | Collins John W | $140,800 |
Source: Public Records
Tax History Compared to Growth
Tax History
| Year | Tax Paid | Tax Assessment Tax Assessment Total Assessment is a certain percentage of the fair market value that is determined by local assessors to be the total taxable value of land and additions on the property. | Land | Improvement |
|---|---|---|---|---|
| 2025 | $4,126 | $706,469 | $44,802 | $661,667 |
| 2024 | $3,949 | $706,469 | $44,802 | $661,667 |
| 2023 | $3,669 | $706,469 | $44,802 | $661,667 |
| 2022 | $2,880 | $378,327 | $28,635 | $349,692 |
| 2021 | $2,917 | $378,327 | $28,635 | $349,692 |
| 2020 | $2,955 | $378,327 | $28,635 | $349,692 |
| 2019 | $2,970 | $378,327 | $28,635 | $349,692 |
| 2018 | $0 | $378,327 | $28,635 | $349,692 |
| 2017 | $2,616 | $378,327 | $28,635 | $349,692 |
| 2016 | $1,232 | $179,916 | $28,458 | $151,458 |
| 2015 | -- | $179,916 | $28,458 | $151,458 |
| 2014 | -- | $179,916 | $28,458 | $151,458 |
Source: Public Records
Map
Nearby Homes
- 000 Durham St
- 0000 Durham Street Extension
- 0 Nc Hwy 62 Unit LotWP001
- 625 Mccray Rd
- 0 Willie Pace Rd
- 526 Bob Rainey Trail
- 1067 Mccray Rd
- 00 Rascoe Rd
- 0 Rascoe Rd
- 3263 Fleming Graham Rd
- 3345 Fleming Graham Rd
- 3295 Fleming Graham Rd
- 30 Stoney Creek Church Rd
- 2533 Holly Brook Dr
- 3655 N Carolina 62
- 2225 Hughes Mill Rd
- 2343 Hughes Mill Rd
- 2265 Hughes Mill Rd
- 2323 Hughes Mill Rd
- 2373 Hughes Mill Rd
- 4856 Lowder Rd
- 4750 Lowder Rd
- 4754 Lowder Rd
- 4736 Lowder Rd
- 4911 Lowder Rd
- VL Carriage Loop
- Lot 4 Melrose Dr
- 0 S Nc Highway 62 Unit 1126535
- 376 Ross Acres Rd
- 0 S Nc Highway 62 Unit 913040
- 0 S Nc Highway 62 Unit 101996
- 1622 Floral Ave
- 1102 Hughes Rd
- 7777 N Nc 62 Hwy Unit 1
- Lot 18 Nc 62 Hwy Unit 18
- Lots 19 & 20 Nc 62 Hwy Unit 19
- Lot 13 Nc 62 Hwy Unit 13
- Lot 16 Nc 62 Hwy Unit 16
- VL Carriage Loop Unit Lot 52
- 7885 N Nc Highway62 Hwy