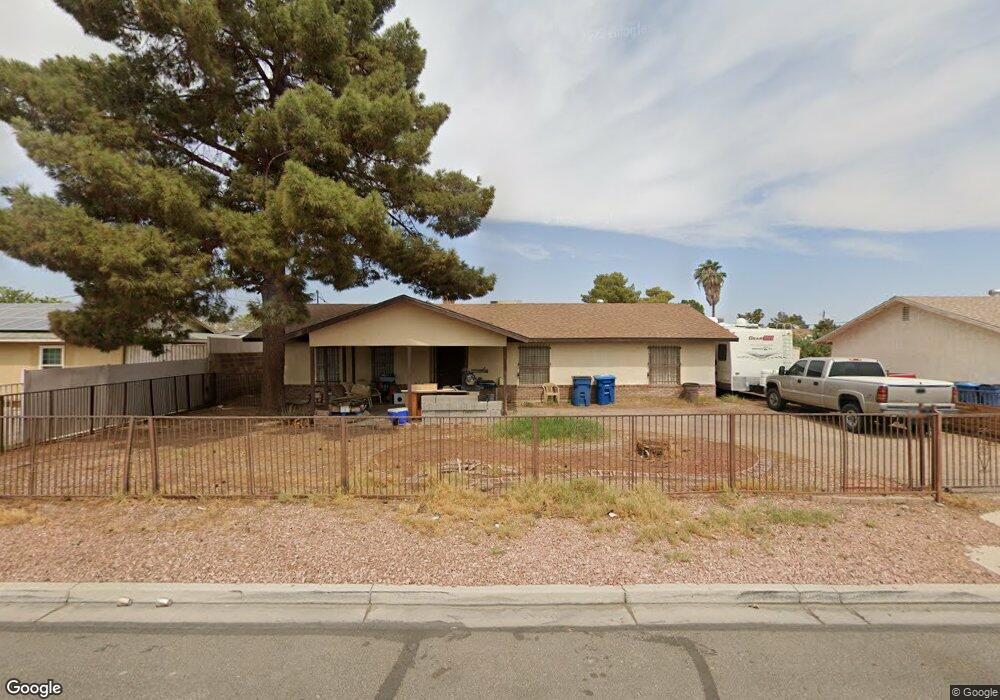
4764 Yuma Ave Las Vegas, NV 89104
Estimated Value: $372,900 - $442,000
3
Beds
2
Baths
1,670
Sq Ft
$236/Sq Ft
Est. Value
About This Home
This home is located at 4764 Yuma Ave, Las Vegas, NV 89104 and is currently estimated at $394,225, approximately $236 per square foot. 4764 Yuma Ave is a home located in Clark County with nearby schools including William E. Snyder Elementary School, Jerome Mack Middle School, and Las Vegas High School.
Ownership History
Date
Name
Owned For
Owner Type
Purchase Details
Closed on
Mar 12, 1998
Sold by
Va
Bought by
Kirk Terry Lee
Current Estimated Value
Home Financials for this Owner
Home Financials are based on the most recent Mortgage that was taken out on this home.
Original Mortgage
$96,301
Outstanding Balance
$17,617
Interest Rate
7.02%
Mortgage Type
Seller Take Back
Estimated Equity
$376,608
Purchase Details
Closed on
Jul 8, 1997
Sold by
Mellon Mtg Company
Bought by
Va
Purchase Details
Closed on
May 16, 1997
Sold by
Pineda David and Pineda Shirley Ann
Bought by
Mellon Mtg Company
Purchase Details
Closed on
Oct 5, 1996
Sold by
Pineda David and Pineda Shirley Ann
Bought by
Pineda Shirley Ann
Purchase Details
Closed on
Jul 12, 1994
Sold by
Borbola Ann and Kiss Ann
Bought by
Pineda David and Pineda Shirley Ann
Home Financials for this Owner
Home Financials are based on the most recent Mortgage that was taken out on this home.
Original Mortgage
$100,878
Interest Rate
8.57%
Mortgage Type
VA
Create a Home Valuation Report for This Property
The Home Valuation Report is an in-depth analysis detailing your home's value as well as a comparison with similar homes in the area
Home Values in the Area
Average Home Value in this Area
Purchase History
| Date | Buyer | Sale Price | Title Company |
|---|---|---|---|
| Kirk Terry Lee | -- | -- | |
| Va | -- | Land Title | |
| Mellon Mtg Company | $80,408 | Land Title | |
| Pineda Shirley Ann | -- | -- | |
| Pineda David | $99,000 | Stewart Title |
Source: Public Records
Mortgage History
| Date | Status | Borrower | Loan Amount |
|---|---|---|---|
| Open | Kirk Terry Lee | $96,301 | |
| Previous Owner | Pineda David | $100,878 |
Source: Public Records
Tax History Compared to Growth
Tax History
| Year | Tax Paid | Tax Assessment Tax Assessment Total Assessment is a certain percentage of the fair market value that is determined by local assessors to be the total taxable value of land and additions on the property. | Land | Improvement |
|---|---|---|---|---|
| 2025 | $834 | $53,355 | $26,250 | $27,105 |
| 2024 | $810 | $53,355 | $26,250 | $27,105 |
| 2023 | $653 | $56,827 | $29,750 | $27,077 |
| 2022 | $787 | $49,796 | $24,500 | $25,296 |
| 2021 | $764 | $45,557 | $21,000 | $24,557 |
| 2020 | $739 | $45,521 | $20,650 | $24,871 |
| 2019 | $730 | $44,183 | $19,250 | $24,933 |
| 2018 | $696 | $36,634 | $12,250 | $24,384 |
| 2017 | $1,094 | $37,316 | $12,250 | $25,066 |
| 2016 | $653 | $35,067 | $9,450 | $25,617 |
| 2015 | $651 | $27,674 | $7,700 | $19,974 |
| 2014 | $631 | $22,108 | $7,000 | $15,108 |
Source: Public Records
Map
Nearby Homes
- 4746 Yuma Ave
- 1485 Arden St
- 4939 Yuma Ave
- 1761 Arden St
- 4709 Mahogany Dr
- 1405 S Nellis Blvd Unit 1121
- 1405 S Nellis Blvd Unit 1008
- 1405 S Nellis Blvd Unit 2082
- 1405 S Nellis Blvd Unit 2117
- 1405 S Nellis Blvd Unit 2087
- 1300 S Arlington St Unit 113
- 1300 S Arlington St Unit 126
- 1300 S Arlington St Unit 120
- 4496 Skyview Dr
- 11 Page St
- 4820 Mahogany Dr
- 4906 E Chicago Ave
- 4458 Skyview Dr
- 4630 E Philadelphia Ave
- 4928 E Philadelphia Ave
- 4756 Yuma Ave
- 4771 Yuma Ave
- 4765 E Colorado Ave
- 4755 E Colorado Ave
- 4779 E Colorado Ave
- 4790 Yuma Ave
- 4765 Yuma Ave
- 4755 Yuma Ave
- 4779 Yuma Ave
- 4745 E Colorado Ave
- 4795 E Colorado Ave
- 4747 Yuma Ave
- 4735 E Colorado Ave
- 4739 Yuma Ave
- 4760 E Colorado Ave
- 4760 E Imperial Ave
- 4770 E Colorado Ave
- 4770 E Imperial Ave
- 4750 E Colorado Ave
- 4810 Yuma Ave