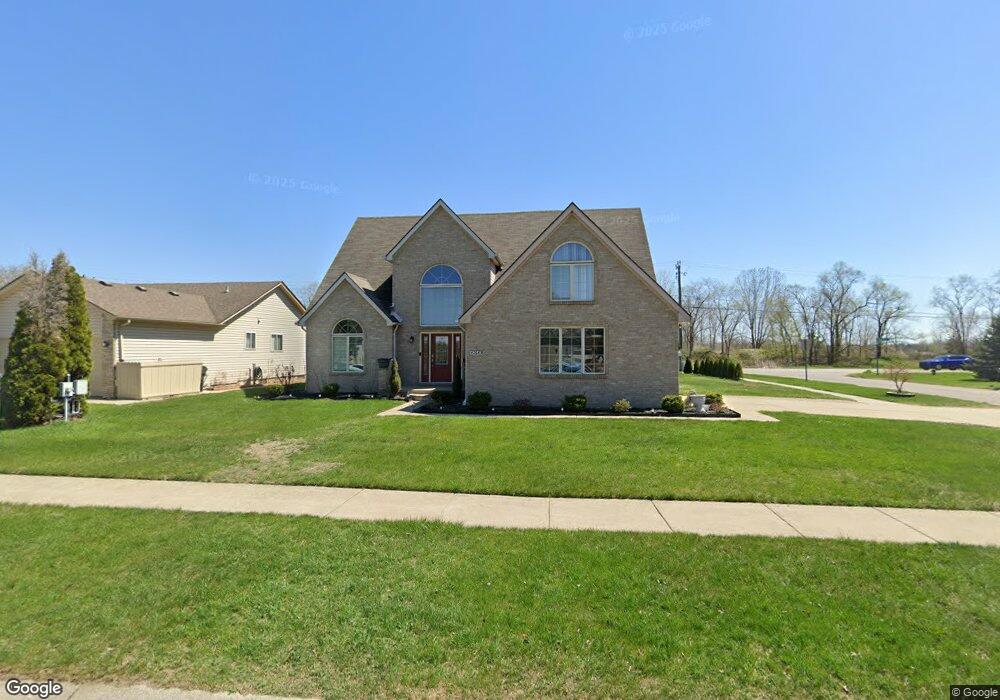
47645 Barclay Ct Unit 1 Shelby Township, MI 48317
Estimated Value: $336,000 - $463,280
3
Beds
4
Baths
2,206
Sq Ft
$189/Sq Ft
Est. Value
About This Home
This home is located at 47645 Barclay Ct Unit 1, Shelby Township, MI 48317 and is currently estimated at $416,070, approximately $188 per square foot. 47645 Barclay Ct Unit 1 is a home located in Macomb County with nearby schools including Roberts Elementary School, Eppler Junior High School, and Utica High School.
Ownership History
Date
Name
Owned For
Owner Type
Purchase Details
Closed on
Dec 5, 2016
Sold by
Chubb Duane R and Chubb Cherish E
Bought by
Namou Husam and Namou Ban
Current Estimated Value
Home Financials for this Owner
Home Financials are based on the most recent Mortgage that was taken out on this home.
Original Mortgage
$208,969
Outstanding Balance
$167,317
Interest Rate
3.25%
Mortgage Type
FHA
Estimated Equity
$248,753
Purchase Details
Closed on
May 6, 2013
Sold by
Federal National Mortgage Association and Fannie Mae
Bought by
Chubb Duane R
Purchase Details
Closed on
Jun 2, 2011
Sold by
Sokana Amir M and Sokana Amira
Bought by
The Federal National Mortgage Associatio
Purchase Details
Closed on
Sep 19, 2005
Sold by
Soakana Amir M and Soakana Amira
Bought by
Sokana Amir M and Sokana Amira
Purchase Details
Closed on
May 10, 1999
Sold by
Wattles Square Inc
Bought by
Soakana Amir M
Create a Home Valuation Report for This Property
The Home Valuation Report is an in-depth analysis detailing your home's value as well as a comparison with similar homes in the area
Home Values in the Area
Average Home Value in this Area
Purchase History
| Date | Buyer | Sale Price | Title Company |
|---|---|---|---|
| Namou Husam | $265,000 | Sterling Title Agency | |
| Chubb Duane R | $221,500 | -- | |
| The Federal National Mortgage Associatio | $151,200 | None Available | |
| Sokana Amir M | -- | -- | |
| Soakana Amir M | $38,500 | -- |
Source: Public Records
Mortgage History
| Date | Status | Borrower | Loan Amount |
|---|---|---|---|
| Open | Namou Husam | $208,969 |
Source: Public Records
Tax History Compared to Growth
Tax History
| Year | Tax Paid | Tax Assessment Tax Assessment Total Assessment is a certain percentage of the fair market value that is determined by local assessors to be the total taxable value of land and additions on the property. | Land | Improvement |
|---|---|---|---|---|
| 2025 | $5,760 | $204,800 | $0 | $0 |
| 2024 | $3,409 | $194,600 | $0 | $0 |
| 2023 | $3,229 | $178,300 | $0 | $0 |
| 2022 | $5,226 | $170,400 | $0 | $0 |
| 2021 | $5,197 | $170,100 | $0 | $0 |
| 2020 | $3,049 | $170,700 | $0 | $0 |
| 2019 | $4,758 | $163,600 | $0 | $0 |
| 2018 | $4,715 | $159,400 | $0 | $0 |
| 2017 | $4,732 | $156,050 | $29,150 | $126,900 |
| 2016 | $3,952 | $156,050 | $0 | $0 |
| 2015 | $3,895 | $145,550 | $0 | $0 |
| 2012 | -- | $0 | $0 | $0 |
Source: Public Records
Map
Nearby Homes
- 2374 Lee Ave
- 2100 Collins Ave
- 47555 Dequindre Rd
- 2165 Leighton Dr
- 2056 Leighton Dr Unit 17
- 2084 Leighton Dr Unit 23
- 2053 Marmoor Dr
- 48571 Lakeview E
- 48574 Lakeview E
- 48575 Sandifer Ct
- 48593 Lakeview E
- 48593 Sandifer Ct
- 48596 Leafdale Ct Unit 178
- 2986 Hessel Ave
- 46419 Huling St
- 1760 E Auburn Rd Unit 301
- 1760 E Auburn Rd Unit 202
- 2333 Longview Ave
- 47141 Greenview Rd
- 47840 Greenview Rd
- 47645 Barclay Ct
- 2541 Barclay Ave
- 47755 Barclay Ct
- 47755 Barclay Ct Unit 4
- 2556 Barclay Ave
- 47716 Barclay Ct
- 2592 Barclay Ave
- 2534 Barclay Ave
- 2510 Barclay Ave
- 2517 Barclay Ave Unit Bldg-Unit
- 2517 Barclay Ave Unit 11
- 47769 Barclay Ct Unit 5
- 2493 Barclay Ave
- 47744 Barclay Ct Unit 8
- 2496 Barclay Ave
- 47793 Barclay Ct
- 47768 Barclay Ct
- 2469 Barclay Ave Unit 13
- 2579 Collins Ave
- 2466 Barclay Ave