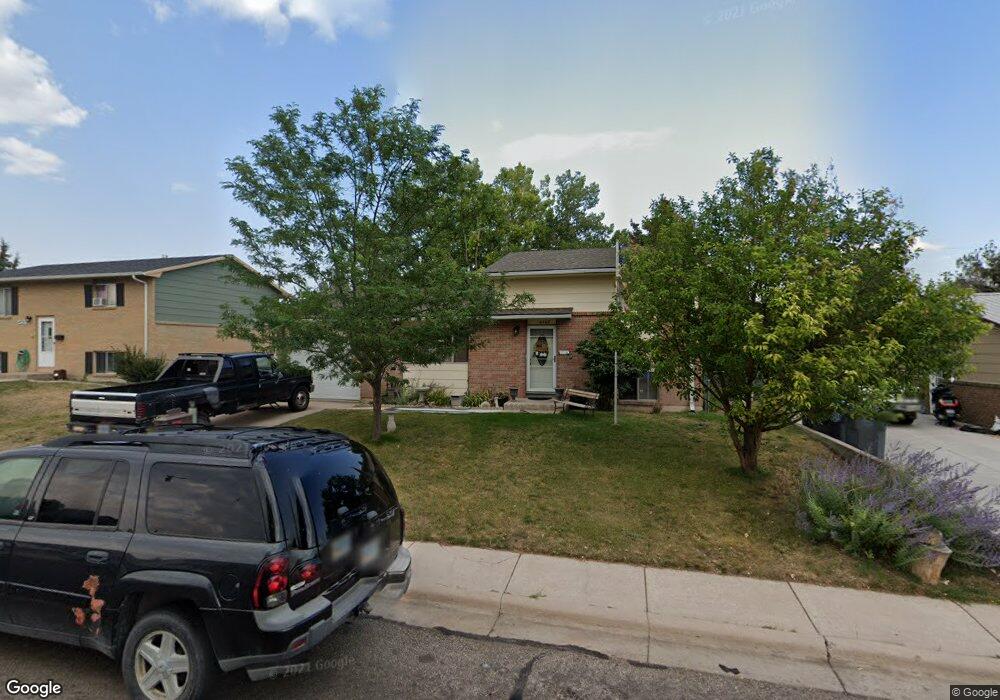
4765 Maple Way Cheyenne, WY 82009
Estimated Value: $295,078 - $340,000
Studio
--
Bath
1,296
Sq Ft
$247/Sq Ft
Est. Value
About This Home
This home is located at 4765 Maple Way, Cheyenne, WY 82009 and is currently estimated at $319,520, approximately $246 per square foot. 4765 Maple Way is a home located in Laramie County with nearby schools including Buffalo Ridge Elementary School, Carey Junior High School, and East High School.
Ownership History
Date
Name
Owned For
Owner Type
Purchase Details
Closed on
Jul 30, 2004
Sold by
Eagen Amy J
Bought by
Nasimok Oleg A and Nasimok Sharon L
Current Estimated Value
Home Financials for this Owner
Home Financials are based on the most recent Mortgage that was taken out on this home.
Original Mortgage
$126,000
Outstanding Balance
$78,053
Interest Rate
9.99%
Mortgage Type
Purchase Money Mortgage
Estimated Equity
$241,467
Purchase Details
Closed on
Mar 18, 2004
Sold by
Gray Anson C
Bought by
Eagen Amy J
Purchase Details
Closed on
Oct 29, 1999
Sold by
Hubbard Donald Jack Leeroy and Hubbard Sheryll Lucille
Bought by
Eagen Amy J and Gray Anson C
Home Financials for this Owner
Home Financials are based on the most recent Mortgage that was taken out on this home.
Original Mortgage
$89,862
Interest Rate
7.85%
Mortgage Type
FHA
Purchase Details
Closed on
Dec 2, 1998
Sold by
Ziemann Helen R
Bought by
Hubbard Donald Jack Leeroy and Hubbard Sheryll L
Create a Home Valuation Report for This Property
The Home Valuation Report is an in-depth analysis detailing your home's value as well as a comparison with similar homes in the area
Purchase History
| Date | Buyer | Sale Price | Title Company |
|---|---|---|---|
| Nasimok Oleg A | -- | Summit Title Services | |
| Eagen Amy J | -- | -- | |
| Eagen Amy J | -- | -- | |
| Hubbard Donald Jack Leeroy | -- | -- |
Source: Public Records
Mortgage History
| Date | Status | Borrower | Loan Amount |
|---|---|---|---|
| Open | Nasimok Oleg A | $126,000 | |
| Previous Owner | Eagen Amy J | $89,862 |
Source: Public Records
Tax History
| Year | Tax Paid | Tax Assessment Tax Assessment Total Assessment is a certain percentage of the fair market value that is determined by local assessors to be the total taxable value of land and additions on the property. | Land | Improvement |
|---|---|---|---|---|
| 2025 | $1,240 | $18,194 | $3,089 | $15,105 |
| 2024 | $1,240 | $23,539 | $4,118 | $19,421 |
| 2023 | $1,222 | $23,276 | $4,118 | $19,158 |
| 2022 | $1,122 | $21,550 | $4,118 | $17,432 |
| 2021 | $954 | $19,185 | $4,118 | $15,067 |
| 2020 | $827 | $17,462 | $4,118 | $13,344 |
| 2019 | $759 | $16,512 | $4,118 | $12,394 |
| 2018 | $704 | $15,836 | $3,092 | $12,744 |
| 2017 | $649 | $14,995 | $3,092 | $11,903 |
| 2016 | $595 | $14,244 | $2,935 | $11,309 |
| 2015 | $531 | $13,350 | $2,935 | $10,415 |
| 2014 | $528 | $13,266 | $2,935 | $10,331 |
Source: Public Records
Map
Nearby Homes
- 5009 Linden Way
- 4728 Linden Way
- 5125 Maple Way
- 4745 Windmill Rd
- 5040 Moran Ave
- 5104 Windmill Rd
- 4771 Greybull Ave
- 4700 King Arthur Way
- 5245 Hickory Place
- 2633 Sagebrush Ave
- 2605 Sagebrush Ave
- 2603 Sagebrush Ave
- 5317 Hilltop Ave
- 2801 Plain View Rd
- 3315 Dean Paul Dr
- 4320 Ridge Rd
- 2434 Foothills Rd
- 3308 Thomas Rd
- 5702 Mica Bluff
- 4744 Piccadilly Dr
- 4759 Maple Way
- 4771 Maple Way
- 4764 Pineridge Ave
- 4758 Pineridge Ave
- 4753 Maple Way
- 4777 Maple Way
- 4770 Pineridge Ave
- 4752 Pineridge Ave
- 4764 Maple Way
- 4758 Maple Way
- 4770 Maple Way
- 4776 Pineridge Ave
- 4752 Maple Way
- 4747 Maple Way
- 4746 Pineridge Ave
- 4785 Maple Way
- 4776 Maple Way
- 4746 Maple Way
- 4765 Linden Way
- 4784 Pineridge Ave
Your Personal Tour Guide
Ask me questions while you tour the home.