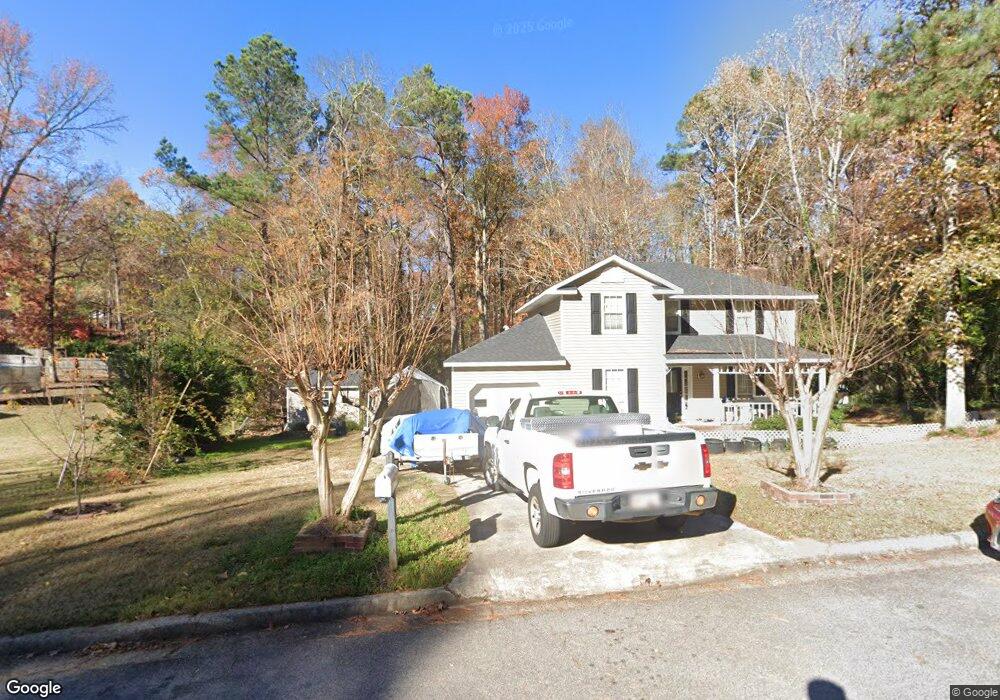
4765 Red Leaf Way Augusta, GA 30907
Estimated Value: $250,000 - $281,005
4
Beds
2
Baths
2,008
Sq Ft
$135/Sq Ft
Est. Value
About This Home
This home is located at 4765 Red Leaf Way, Augusta, GA 30907 and is currently estimated at $272,001, approximately $135 per square foot. 4765 Red Leaf Way is a home located in Columbia County with nearby schools including Westmont Elementary School, Columbia Middle School, and Evans High School.
Ownership History
Date
Name
Owned For
Owner Type
Purchase Details
Closed on
Jan 27, 2022
Sold by
Secretary Of Veterans Affairs
Bought by
Davis Paul M
Current Estimated Value
Purchase Details
Closed on
Oct 5, 2021
Sold by
Phh Mtg Corp
Bought by
Secretary Of Veterans Affairs
Purchase Details
Closed on
Feb 28, 2005
Sold by
Larsen Kelly Louise
Bought by
Talley Curtis L
Home Financials for this Owner
Home Financials are based on the most recent Mortgage that was taken out on this home.
Original Mortgage
$124,600
Interest Rate
5.6%
Mortgage Type
VA
Purchase Details
Closed on
Dec 29, 2004
Sold by
Va
Bought by
Chaplin Audrey G
Home Financials for this Owner
Home Financials are based on the most recent Mortgage that was taken out on this home.
Original Mortgage
$97,343
Interest Rate
5.63%
Mortgage Type
Purchase Money Mortgage
Purchase Details
Closed on
Dec 2, 2003
Sold by
Mortgage Electronic Registration Systems
Bought by
Va
Create a Home Valuation Report for This Property
The Home Valuation Report is an in-depth analysis detailing your home's value as well as a comparison with similar homes in the area
Home Values in the Area
Average Home Value in this Area
Purchase History
| Date | Buyer | Sale Price | Title Company |
|---|---|---|---|
| Davis Paul M | $169,000 | -- | |
| Secretary Of Veterans Affairs | $143,263 | -- | |
| Phh Mtg Corp | -- | -- | |
| Talley Curtis L | -- | -- | |
| Larsen Kelly Louise | $122,000 | -- | |
| Chaplin Audrey G | -- | -- | |
| Va | -- | -- | |
| Mortgage Electronic Registration Systems | $104,775 | -- |
Source: Public Records
Mortgage History
| Date | Status | Borrower | Loan Amount |
|---|---|---|---|
| Previous Owner | Larsen Kelly Louise | $124,600 | |
| Previous Owner | Chaplin Audrey G | $97,343 |
Source: Public Records
Tax History
| Year | Tax Paid | Tax Assessment Tax Assessment Total Assessment is a certain percentage of the fair market value that is determined by local assessors to be the total taxable value of land and additions on the property. | Land | Improvement |
|---|---|---|---|---|
| 2025 | $2,617 | $109,786 | $19,804 | $89,982 |
| 2024 | $2,682 | $107,408 | $18,404 | $89,004 |
| 2023 | $2,682 | $100,462 | $17,204 | $83,258 |
| 2022 | $2,332 | $89,814 | $16,004 | $73,810 |
| 2021 | $2,140 | $78,744 | $13,704 | $65,040 |
| 2020 | $2,015 | $72,635 | $12,804 | $59,831 |
| 2019 | $1,930 | $69,551 | $12,204 | $57,347 |
| 2018 | $1,831 | $65,786 | $11,404 | $54,382 |
| 2017 | $1,935 | $69,272 | $11,504 | $57,768 |
| 2016 | $1,776 | $65,914 | $11,080 | $54,834 |
| 2015 | $1,730 | $64,106 | $10,380 | $53,726 |
| 2014 | $1,697 | $62,116 | $9,580 | $52,536 |
Source: Public Records
Map
Nearby Homes
- 4770 Red Leaf Ct
- 4755 Maple Spring Ct
- 4699 Brookwood Ln
- 4680 Oakley Pirkle Rd
- 4701 Perry Mill Cir
- 1599 Baldwin Lakes Dr
- 1552 Baldwin Lakes Dr
- 4777 Cold Springs Dr
- 336 Patton Ct
- 6007 Big Pond Trail
- 5935 Big Pond Trail
- 6070 Big Pond Trail
- 5927 Big Pond Trail
- 249 Ashbrook Dr
- 409 Constitution Ave
- 303 Meadowlake Dr
- 4660 Millhaven Rd
- 2111 Magnolia Pkwy
- 4572 Oakley Pirkle Rd
- 319 Rockdale Rd
- 4765 Red Leaf Ct
- 119 Maple Creek Dr
- 4767 Red Leaf Ct
- 4764 Red Leaf Ct
- 117 Maple Creek Dr
- 4766 Red Leaf Ct
- 4769 Red Leaf Ct
- 123 Maple Creek Dr
- 116 Maple Creek Dr
- 115 Maple Creek Dr
- 4706 Brookwood Dr
- 4708 Brookwood Dr
- 4768 Red Leaf Ct
- 4710 Brookwood Dr
- 4712 Brookwood Dr
- 4760 Red Leaf Way
- 112 Maple Creek Dr
- 4714 Brookwood Dr
- 125 Maple Creek Dr
- 4716 Brookwood Dr
Your Personal Tour Guide
Ask me questions while you tour the home.