Estimated Value: $364,000 - $394,000
4
Beds
2
Baths
1,456
Sq Ft
$262/Sq Ft
Est. Value
About This Home
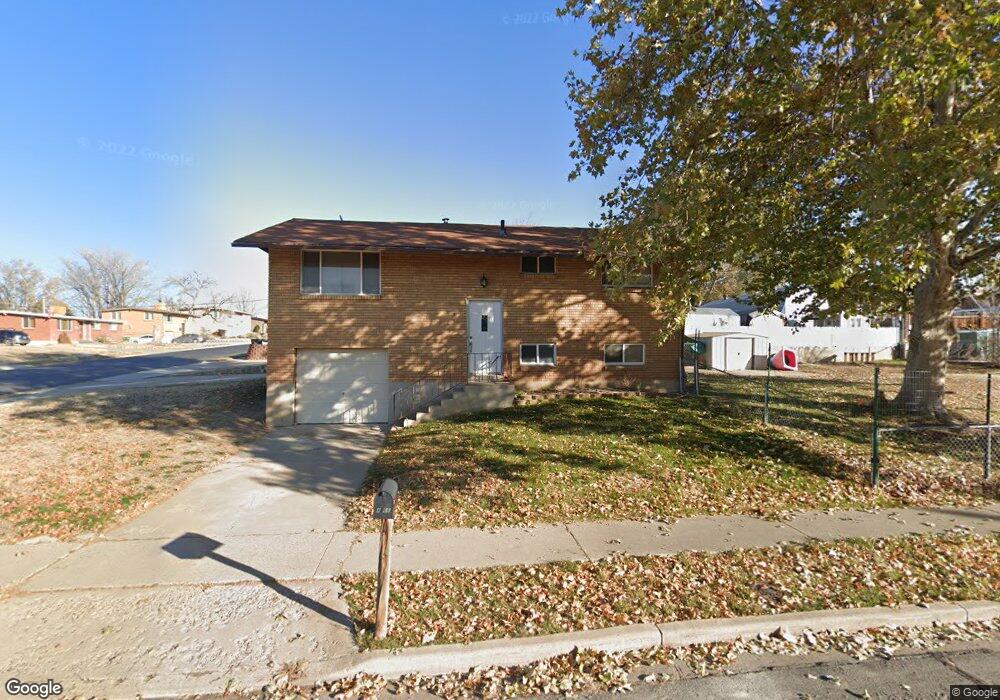
This home is located at 4766 S 2575 W, Roy, UT 84067 and is currently estimated at $381,218, approximately $261 per square foot. 4766 S 2575 W is a home located in Weber County with nearby schools including Valley View School, Sand Ridge Junior High School, and Roy High School.
Ownership History
Date
Name
Owned For
Owner Type
Purchase Details
Closed on
Aug 24, 2020
Sold by
Brown Mark William and Curletto Valeria
Bought by
Brown Mark William and Curletto Valeria
Current Estimated Value
Home Financials for this Owner
Home Financials are based on the most recent Mortgage that was taken out on this home.
Original Mortgage
$224,500
Outstanding Balance
$198,776
Interest Rate
2.9%
Mortgage Type
New Conventional
Estimated Equity
$182,442
Purchase Details
Closed on
Oct 30, 2018
Sold by
Carlson Joshua M and Carlson Caraline S
Bought by
Brown Mark William and Curletto Valeria
Home Financials for this Owner
Home Financials are based on the most recent Mortgage that was taken out on this home.
Original Mortgage
$214,051
Interest Rate
5.37%
Mortgage Type
FHA
Purchase Details
Closed on
Dec 2, 2010
Sold by
Olsen Dustin and Gray Kimberlee
Bought by
Olsen Dustin D and Olsen Kimberlee A
Home Financials for this Owner
Home Financials are based on the most recent Mortgage that was taken out on this home.
Original Mortgage
$112,250
Interest Rate
4.18%
Mortgage Type
New Conventional
Purchase Details
Closed on
Apr 2, 2007
Sold by
Gray Kim A
Bought by
Olsen Dustin and Gray Kimberlee
Home Financials for this Owner
Home Financials are based on the most recent Mortgage that was taken out on this home.
Original Mortgage
$114,000
Interest Rate
6.2%
Mortgage Type
Purchase Money Mortgage
Purchase Details
Closed on
Feb 10, 2005
Sold by
Horne R Thomas and Horne Gail G
Bought by
Gray Kim A
Purchase Details
Closed on
Nov 21, 1996
Sold by
Beeman David E and Beeman Debbie A
Bought by
Horne R Thomas and Horne Gail G
Home Financials for this Owner
Home Financials are based on the most recent Mortgage that was taken out on this home.
Original Mortgage
$85,680
Interest Rate
8%
Mortgage Type
VA
Create a Home Valuation Report for This Property
The Home Valuation Report is an in-depth analysis detailing your home's value as well as a comparison with similar homes in the area
Home Values in the Area
Average Home Value in this Area
Purchase History
| Date | Buyer | Sale Price | Title Company |
|---|---|---|---|
| Brown Mark William | -- | Metro National Title | |
| Brown Mark William | -- | Title Guarantee Layton | |
| Olsen Dustin D | -- | Bonneville Superior Title Co | |
| Olsen Dustin | -- | Mountain View Title Ogden | |
| Gray Kim A | -- | Heritage West Title Ins | |
| Horne R Thomas | -- | U S Title |
Source: Public Records
Mortgage History
| Date | Status | Borrower | Loan Amount |
|---|---|---|---|
| Open | Brown Mark William | $224,500 | |
| Closed | Brown Mark William | $214,051 | |
| Previous Owner | Olsen Dustin D | $112,250 | |
| Previous Owner | Olsen Dustin | $114,000 | |
| Previous Owner | Horne R Thomas | $85,680 |
Source: Public Records
Tax History Compared to Growth
Tax History
| Year | Tax Paid | Tax Assessment Tax Assessment Total Assessment is a certain percentage of the fair market value that is determined by local assessors to be the total taxable value of land and additions on the property. | Land | Improvement |
|---|---|---|---|---|
| 2025 | $2,270 | $353,699 | $120,000 | $233,699 |
| 2024 | $2,217 | $191,399 | $66,000 | $125,399 |
| 2023 | $2,088 | $179,850 | $63,153 | $116,697 |
| 2022 | $2,352 | $211,750 | $55,002 | $156,748 |
| 2021 | $1,756 | $256,000 | $70,019 | $185,981 |
| 2020 | $1,577 | $210,000 | $70,019 | $139,981 |
| 2019 | $1,603 | $202,000 | $40,016 | $161,984 |
| 2018 | $1,529 | $181,000 | $36,029 | $144,971 |
| 2017 | $1,384 | $152,000 | $36,029 | $115,971 |
| 2016 | $1,298 | $76,243 | $19,021 | $57,222 |
| 2015 | $1,137 | $67,365 | $19,021 | $48,344 |
| 2014 | $1,136 | $66,654 | $16,160 | $50,494 |
Source: Public Records
Map
Nearby Homes