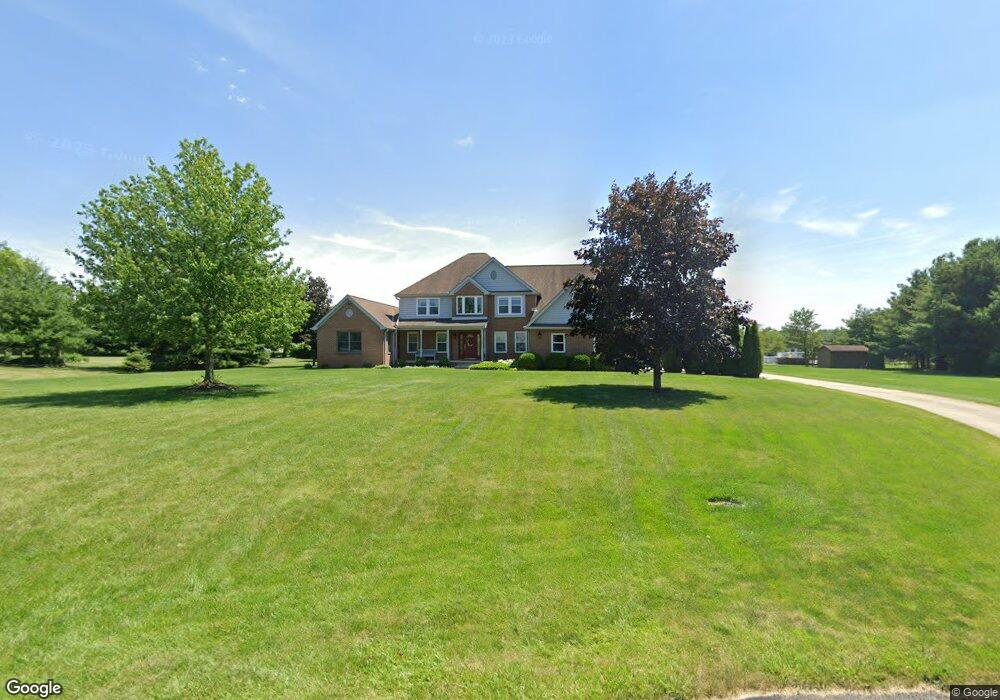
4767 Canterbury Cir Delaware, OH 43015
Concord NeighborhoodEstimated Value: $606,000 - $731,000
4
Beds
3
Baths
2,600
Sq Ft
$255/Sq Ft
Est. Value
About This Home
This home is located at 4767 Canterbury Cir, Delaware, OH 43015 and is currently estimated at $663,122, approximately $255 per square foot. 4767 Canterbury Cir is a home located in Delaware County with nearby schools including Buckeye Valley High School and The Emilia School.
Ownership History
Date
Name
Owned For
Owner Type
Purchase Details
Closed on
Jan 8, 2021
Sold by
Ailabouni Joseph R and Ailabouni Ilham F
Bought by
Ailabouni Family Revocable Trust and Ailabouni
Current Estimated Value
Purchase Details
Closed on
Nov 19, 2020
Sold by
Ailabouni Joseph R and Ailabouni Ilham F
Bought by
Ailabouni Tom and Ailabouni Family Revocable Tru
Purchase Details
Closed on
May 22, 2020
Sold by
Ailabouni Joseph R
Bought by
Ailabouni Ilham
Purchase Details
Closed on
Nov 19, 1999
Sold by
Erdos Michael W
Bought by
Ailabouni Joseph and Ailabouni Ilham
Create a Home Valuation Report for This Property
The Home Valuation Report is an in-depth analysis detailing your home's value as well as a comparison with similar homes in the area
Home Values in the Area
Average Home Value in this Area
Purchase History
| Date | Buyer | Sale Price | Title Company |
|---|---|---|---|
| Ailabouni Family Revocable Trust | -- | None Listed On Document | |
| Ailabouni Tom | -- | None Available | |
| Ailabouni Ilham | -- | None Available | |
| Ailabouni Joseph | $253,000 | -- |
Source: Public Records
Tax History Compared to Growth
Tax History
| Year | Tax Paid | Tax Assessment Tax Assessment Total Assessment is a certain percentage of the fair market value that is determined by local assessors to be the total taxable value of land and additions on the property. | Land | Improvement |
|---|---|---|---|---|
| 2024 | $6,082 | $185,680 | $32,550 | $153,130 |
| 2023 | $6,097 | $185,680 | $32,550 | $153,130 |
| 2022 | $4,997 | $139,270 | $23,560 | $115,710 |
| 2021 | $4,999 | $139,270 | $23,560 | $115,710 |
| 2020 | $5,031 | $139,270 | $23,560 | $115,710 |
| 2019 | $4,682 | $119,990 | $23,560 | $96,430 |
| 2018 | $4,756 | $119,990 | $23,560 | $96,430 |
| 2017 | $4,163 | $101,160 | $17,610 | $83,550 |
| 2016 | $3,705 | $101,160 | $17,610 | $83,550 |
| 2015 | $3,902 | $101,160 | $17,610 | $83,550 |
| 2014 | $3,677 | $101,160 | $17,610 | $83,550 |
| 2013 | $3,706 | $98,710 | $17,610 | $81,100 |
Source: Public Records
Map
Nearby Homes
- 6299 S Section Line Rd
- 0 S Section Line Rd Unit Tract 6 225024549
- 0 S Section Line Rd Unit Tract 5 225024546
- 0 S Section Line Rd Unit Tract 4B 225024545
- 0 S Section Line Rd Unit Tract 4A 225024542
- 0 S Section Line Rd Unit Tract 3 225024539
- 0 S Section Line Rd Unit Tract 2B 225024538
- 0 S Section Line Rd Unit Tract 2A 225024534
- 0 S Section Line Rd Unit Tract 1 225024531
- 5968 S Section Line Rd
- 4845 Highlands Dr
- 6607 Riverrun Ln
- The Iris Residence Plan at Reserve at Scioto Bluff
- Scarlett Custom Plan A at Reserve at Scioto Bluff
- Kline Residence Plan at Reserve at Scioto Bluff
- Ferryman Residence Plan at Reserve at Scioto Bluff
- Ashford Plan at Reserve at Scioto Bluff
- Sawyer Plan at Reserve at Scioto Bluff
- 2019 Parade of Homes | Evans Farm Central Plan at Reserve at Scioto Bluff
- Beckner Residence Plan at Reserve at Scioto Bluff
- 4743 Canterbury Cir
- 4783 Canterbury Cir
- 4792 Hyatts Rd
- 4820 Hyatts Rd
- 4717 Canterbury Cir
- 4778 Canterbury Cir
- 4760 Hyatts Rd
- 4840 Hyatts Rd
- 4756 Canterbury Cir
- 4734 Canterbury Cir
- 4740 Hyatts Rd
- 4695 Canterbury Cir
- 0 Canterbury Cir
- 4710 Canterbury Cir
- 4900 Hyatts Rd
- 6205 S Section Line Rd
- 6275 S Section Line Rd
- 4708 Hyatts Rd
- 6235 S Section Line Rd
- 4686 Canterbury Cir