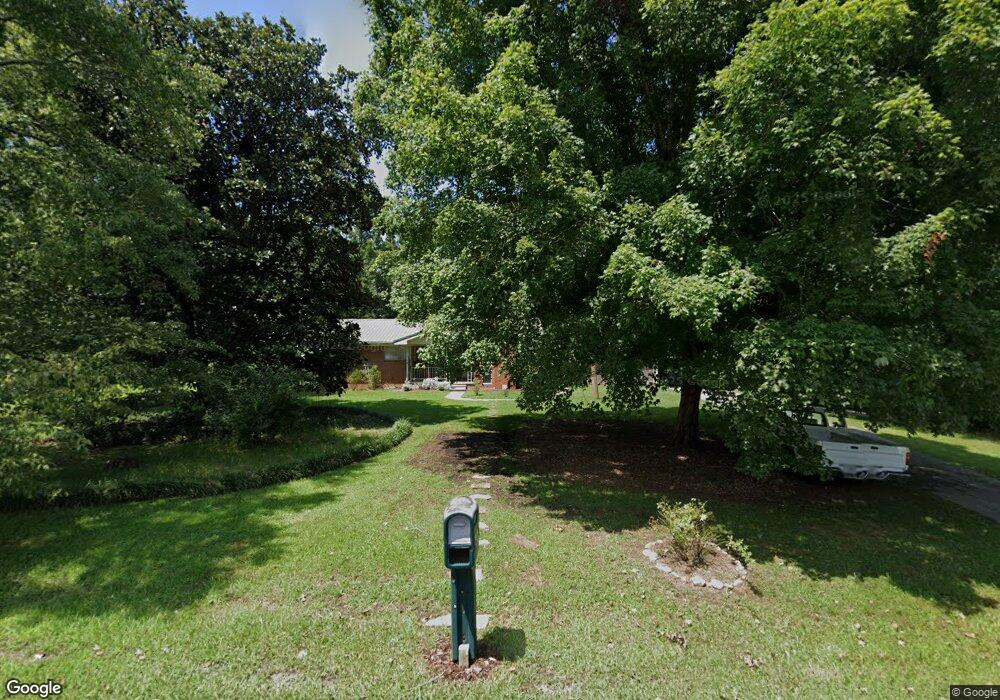
4767 Riverside Dr SE Dalton, GA 30721
Estimated Value: $230,000 - $254,000
3
Beds
2
Baths
1,787
Sq Ft
$138/Sq Ft
Est. Value
About This Home
This home is located at 4767 Riverside Dr SE, Dalton, GA 30721 and is currently estimated at $245,899, approximately $137 per square foot. 4767 Riverside Dr SE is a home located in Whitfield County with nearby schools including Cedar Ridge Elementary School, Eastbrook Middle School, and Southeast Whitfield County High School.
Ownership History
Date
Name
Owned For
Owner Type
Purchase Details
Closed on
Aug 5, 2009
Sold by
Federal National Mortgage Association
Bought by
Rogers Helen C
Current Estimated Value
Home Financials for this Owner
Home Financials are based on the most recent Mortgage that was taken out on this home.
Original Mortgage
$91,971
Outstanding Balance
$59,904
Interest Rate
5.19%
Mortgage Type
FHA
Estimated Equity
$185,995
Purchase Details
Closed on
Dec 13, 2006
Sold by
Sewell Dana A
Bought by
Fraire Alejandra
Home Financials for this Owner
Home Financials are based on the most recent Mortgage that was taken out on this home.
Original Mortgage
$133,900
Interest Rate
6.19%
Mortgage Type
New Conventional
Purchase Details
Closed on
Aug 19, 2005
Sold by
Welch Dawn
Bought by
Sewell Dana A and Sewell Teresa F
Home Financials for this Owner
Home Financials are based on the most recent Mortgage that was taken out on this home.
Original Mortgage
$118,800
Interest Rate
5.64%
Mortgage Type
New Conventional
Create a Home Valuation Report for This Property
The Home Valuation Report is an in-depth analysis detailing your home's value as well as a comparison with similar homes in the area
Home Values in the Area
Average Home Value in this Area
Purchase History
| Date | Buyer | Sale Price | Title Company |
|---|---|---|---|
| Rogers Helen C | $93,000 | -- | |
| Fraire Alejandra | $133,900 | -- | |
| Sewell Dana A | $148,000 | -- |
Source: Public Records
Mortgage History
| Date | Status | Borrower | Loan Amount |
|---|---|---|---|
| Open | Rogers Helen C | $91,971 | |
| Previous Owner | Fraire Alejandra | $133,900 | |
| Previous Owner | Sewell Dana A | $118,800 |
Source: Public Records
Tax History Compared to Growth
Tax History
| Year | Tax Paid | Tax Assessment Tax Assessment Total Assessment is a certain percentage of the fair market value that is determined by local assessors to be the total taxable value of land and additions on the property. | Land | Improvement |
|---|---|---|---|---|
| 2024 | $374 | $103,078 | $12,492 | $90,586 |
| 2023 | $374 | $67,084 | $12,492 | $54,592 |
| 2022 | $927 | $60,977 | $12,492 | $48,485 |
| 2021 | $1,799 | $60,977 | $12,492 | $48,485 |
| 2020 | $1,860 | $60,977 | $12,492 | $48,485 |
| 2019 | $1,817 | $58,616 | $12,492 | $46,124 |
| 2018 | $1,847 | $58,616 | $12,492 | $46,124 |
| 2017 | $1,848 | $58,616 | $12,492 | $46,124 |
| 2016 | $1,606 | $52,978 | $10,500 | $42,478 |
| 2014 | $1,426 | $52,978 | $10,500 | $42,478 |
| 2013 | -- | $52,978 | $10,500 | $42,478 |
Source: Public Records
Map
Nearby Homes
- 741 North Dr SE
- 4386 Tibbs Bridge Rd SE
- 0 Ledford Ave SE
- 185 Cedar Ridge Rd
- 4322 Banks Dr SE
- 156 Goldsmith Ln
- 760 Keith Rd SE
- 0 Leon Cir
- 4988 Tibbs Bridge Rd SE
- 185 Cedar Ridge Rd SE
- 279 Satterfield Rd SE
- 59 Terrace Ct
- 210 Gordon Dr
- 543 Callie Jones Rd
- 404 Lakeview Dr SE
- 2442 Tibbs Bridge Rd
- 0 Tibbs Bridge Rd SE
- 3807 Georgia 52
- 01 Headrick Cir SE
- 00 Headrick Cir SE
- 4770 Riverside Dr SE
- 4470 SE Riverside Dr
- 4764 Riverside Dr SE
- 4780 Riverside Dr SE
- 4756 Riverside Dr SE
- 4779 Riverside Dr SE
- 4752 Riverside Dr SE
- 729 North Dr SE
- 4746 Riverside Dr SE
- 723 North Dr SE
- 719 North Dr SE
- 4738 Riverside Dr SE
- 713 North Dr SE
- 740 North Dr SE
- 720 North Dr SE
- 709 North Dr SE
- 705 North Dr SE
- 4725 Riverside Dr SE
- 712 North Dr SE
- 75 North