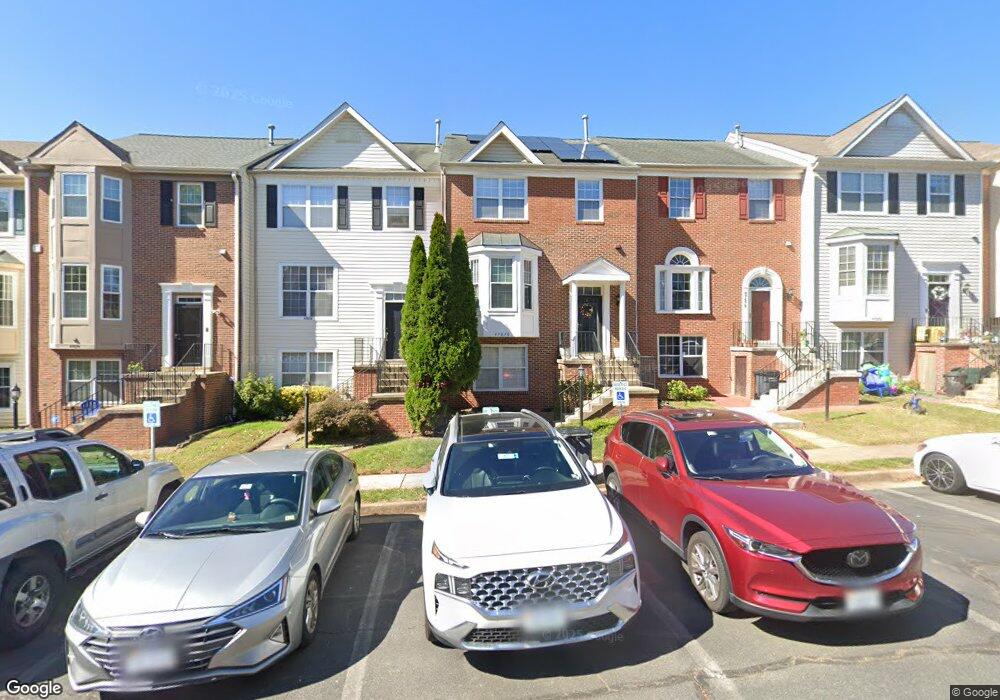
47676 Comer Square Sterling, VA 20165
Estimated Value: $605,000 - $651,000
4
Beds
4
Baths
2,225
Sq Ft
$283/Sq Ft
Est. Value
About This Home
This home is located at 47676 Comer Square, Sterling, VA 20165 and is currently estimated at $630,174, approximately $283 per square foot. 47676 Comer Square is a home located in Loudoun County with nearby schools including Lowes Island Elementary School, Seneca Ridge Middle School, and Dominion High School.
Ownership History
Date
Name
Owned For
Owner Type
Purchase Details
Closed on
May 16, 2005
Sold by
Schall Jeffrey M
Bought by
Sileo Thomas A
Current Estimated Value
Home Financials for this Owner
Home Financials are based on the most recent Mortgage that was taken out on this home.
Original Mortgage
$321,500
Outstanding Balance
$165,529
Interest Rate
6.05%
Mortgage Type
New Conventional
Estimated Equity
$464,645
Purchase Details
Closed on
Aug 28, 2001
Sold by
Burch Kenneth J
Bought by
Schall Jeffrey M
Home Financials for this Owner
Home Financials are based on the most recent Mortgage that was taken out on this home.
Original Mortgage
$201,465
Interest Rate
7.06%
Purchase Details
Closed on
Jul 26, 1994
Sold by
Us Home Corp
Bought by
Burch Kenneth J
Home Financials for this Owner
Home Financials are based on the most recent Mortgage that was taken out on this home.
Original Mortgage
$159,950
Interest Rate
8.19%
Create a Home Valuation Report for This Property
The Home Valuation Report is an in-depth analysis detailing your home's value as well as a comparison with similar homes in the area
Home Values in the Area
Average Home Value in this Area
Purchase History
| Date | Buyer | Sale Price | Title Company |
|---|---|---|---|
| Sileo Thomas A | $471,500 | -- | |
| Schall Jeffrey M | $251,835 | -- | |
| Burch Kenneth J | $168,397 | -- |
Source: Public Records
Mortgage History
| Date | Status | Borrower | Loan Amount |
|---|---|---|---|
| Open | Sileo Thomas A | $321,500 | |
| Previous Owner | Schall Jeffrey M | $201,465 | |
| Previous Owner | Burch Kenneth J | $159,950 |
Source: Public Records
Tax History
| Year | Tax Paid | Tax Assessment Tax Assessment Total Assessment is a certain percentage of the fair market value that is determined by local assessors to be the total taxable value of land and additions on the property. | Land | Improvement |
|---|---|---|---|---|
| 2025 | $4,553 | $565,630 | $190,000 | $375,630 |
| 2024 | $4,694 | $542,630 | $175,000 | $367,630 |
| 2023 | $4,471 | $511,000 | $175,000 | $336,000 |
| 2022 | $4,342 | $487,910 | $150,000 | $337,910 |
| 2021 | $4,373 | $446,190 | $130,000 | $316,190 |
| 2020 | $4,289 | $414,360 | $125,000 | $289,360 |
| 2019 | $4,198 | $401,690 | $125,000 | $276,690 |
| 2018 | $4,182 | $385,410 | $125,000 | $260,410 |
| 2017 | $4,174 | $370,990 | $125,000 | $245,990 |
| 2016 | $4,234 | $369,810 | $0 | $0 |
| 2015 | $4,300 | $253,840 | $0 | $253,840 |
| 2014 | $4,346 | $251,290 | $0 | $251,290 |
Source: Public Records
Map
Nearby Homes
- 20803 Blossom Landing Way
- 11815 Brockman Ln
- 10217 Mckean Ct
- 20630 Muddy Harbour Square
- 47392 Victoria Falls Square
- 47379 Darkhollow Falls Terrace
- 20572 Willoughby Square
- 47807 Blockhouse Point Place
- 47784 Fathom Place
- 20548 Tidewater Ct
- 353 Gallop Wood Place
- 10172 Yorktown Way
- 47421 River Crest St
- 20500 Tappahannock Place
- 47787 Brawner Place
- 423 Seneca Rd
- 11500 Great Falls Way
- 20461 Swan Creek Ct
- 615 Kentland Dr
- 9 Wrightwood Place
- 47678 Comer Square
- 47674 Comer Square
- 47672 Comer Square
- 47680 Comer Square
- 47670 Comer Square
- 47682 Comer Square
- 47646 Comer Square
- 47644 Comer Square
- 47595 Watkins Island Square
- 47642 Comer Square
- 47677 Comer Square
- 47675 Comer Square
- 47593 Watkins Island Square
- 47679 Comer Square
- 47673 Comer Square
- 47640 Comer Square
- 47681 Comer Square
- 47671 Comer Square
- 47591 Watkins Island Square
- 47683 Comer Square
Your Personal Tour Guide
Ask me questions while you tour the home.