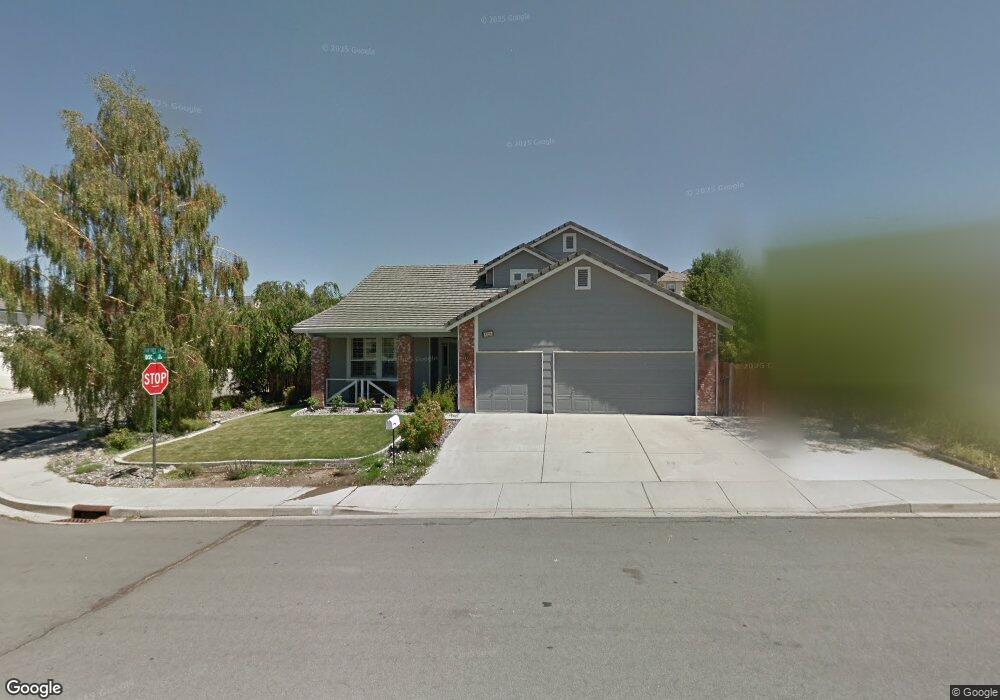
4768 Firtree Ln Sparks, NV 89436
Los Altos Parkway NeighborhoodEstimated Value: $622,001 - $638,000
4
Beds
3
Baths
2,495
Sq Ft
$254/Sq Ft
Est. Value
About This Home
This home is located at 4768 Firtree Ln, Sparks, NV 89436 and is currently estimated at $633,750, approximately $254 per square foot. 4768 Firtree Ln is a home located in Washoe County with nearby schools including Bud Beasley Elementary School, Lou Mendive Middle School, and Edward C Reed High School.
Ownership History
Date
Name
Owned For
Owner Type
Purchase Details
Closed on
Sep 16, 1996
Sold by
Rice Bruce A and Sorum Deborah J
Bought by
Rice Bruce A and Rice Deborah J
Current Estimated Value
Purchase Details
Closed on
Jun 24, 1996
Sold by
Westlake Glyn and Westlake Colleen
Bought by
Rice Bruce A and Sorum Deborah L
Home Financials for this Owner
Home Financials are based on the most recent Mortgage that was taken out on this home.
Original Mortgage
$159,900
Outstanding Balance
$10,300
Interest Rate
8.09%
Estimated Equity
$623,450
Purchase Details
Closed on
Oct 12, 1994
Sold by
Centex Real Estate Corp
Bought by
Westlake Glyn and Westlake Colleen
Home Financials for this Owner
Home Financials are based on the most recent Mortgage that was taken out on this home.
Original Mortgage
$91,400
Interest Rate
5.12%
Create a Home Valuation Report for This Property
The Home Valuation Report is an in-depth analysis detailing your home's value as well as a comparison with similar homes in the area
Home Values in the Area
Average Home Value in this Area
Purchase History
| Date | Buyer | Sale Price | Title Company |
|---|---|---|---|
| Rice Bruce A | -- | Stewart Title | |
| Rice Bruce A | $200,000 | Stewart Title | |
| Westlake Glyn | $191,500 | First Centennial Title Co |
Source: Public Records
Mortgage History
| Date | Status | Borrower | Loan Amount |
|---|---|---|---|
| Open | Rice Bruce A | $159,900 | |
| Previous Owner | Westlake Glyn | $91,400 |
Source: Public Records
Tax History Compared to Growth
Tax History
| Year | Tax Paid | Tax Assessment Tax Assessment Total Assessment is a certain percentage of the fair market value that is determined by local assessors to be the total taxable value of land and additions on the property. | Land | Improvement |
|---|---|---|---|---|
| 2025 | $3,193 | $122,496 | $42,560 | $79,937 |
| 2024 | $3,193 | $120,995 | $40,075 | $80,920 |
| 2023 | $3,101 | $115,663 | $38,710 | $76,953 |
| 2022 | $3,011 | $97,308 | $32,830 | $64,478 |
| 2021 | $2,925 | $88,236 | $23,835 | $64,401 |
| 2020 | $2,838 | $88,590 | $23,800 | $64,790 |
| 2019 | $2,756 | $86,620 | $24,360 | $62,260 |
| 2018 | $2,676 | $78,910 | $17,780 | $61,130 |
| 2017 | $2,599 | $77,802 | $16,450 | $61,352 |
| 2016 | $2,533 | $77,291 | $14,525 | $62,766 |
| 2015 | $2,528 | $75,779 | $12,880 | $62,899 |
| 2014 | $2,454 | $71,451 | $10,885 | $60,566 |
| 2013 | -- | $64,768 | $8,925 | $55,843 |
Source: Public Records
Map
Nearby Homes
- 4675 Firtree Ln
- 1550 Istrice Rd
- 1685 Southview Dr
- 1560 Freeman Way
- 4393 Acobat Ct
- 1850 Almonte Ct
- 1484 Serendipity Ct
- 4383 Setting Sun Ct Unit 1
- 4788 Ravello Dr
- 1557 Satellite Dr
- 1716 Canyon Terrace Dr
- 1475 Golddust Dr
- 1388 Lambrays Ln
- 5276 Santa Rosa Ave
- 1215 Ebling Dr
- 4601 N Cactus Hills Ct
- 5105 Santa Anita Dr
- 1357 Silver View Cir
- 4515 Whitney Cir
- 1304 Lambrusca Dr
- 4760 Firtree Ln
- 5641 Firtree Ln
- 1785 Disc Dr
- 4752 Firtree Ln
- 1597 Disc Dr
- 1618 Disc Dr
- 1638 Disc Dr
- 1610 Disc Dr
- 1590 Squirreltail Dr
- 1747 Cloud Peak Dr
- 1743 Cloud Peak Dr
- 4742 Firtree Ln
- 1658 Disc Dr Unit 1
- 1589 Disc Dr
- 1739 Cloud Peak Dr
- 1580 Squirreltail Dr
- 4796 Crestside Dr
- 1590 Disc Dr
- 1678 Disc Dr Unit 3
- 1678 Disc Dr