Estimated Value: $294,000 - $343,000
3
Beds
3
Baths
2,008
Sq Ft
$158/Sq Ft
Est. Value
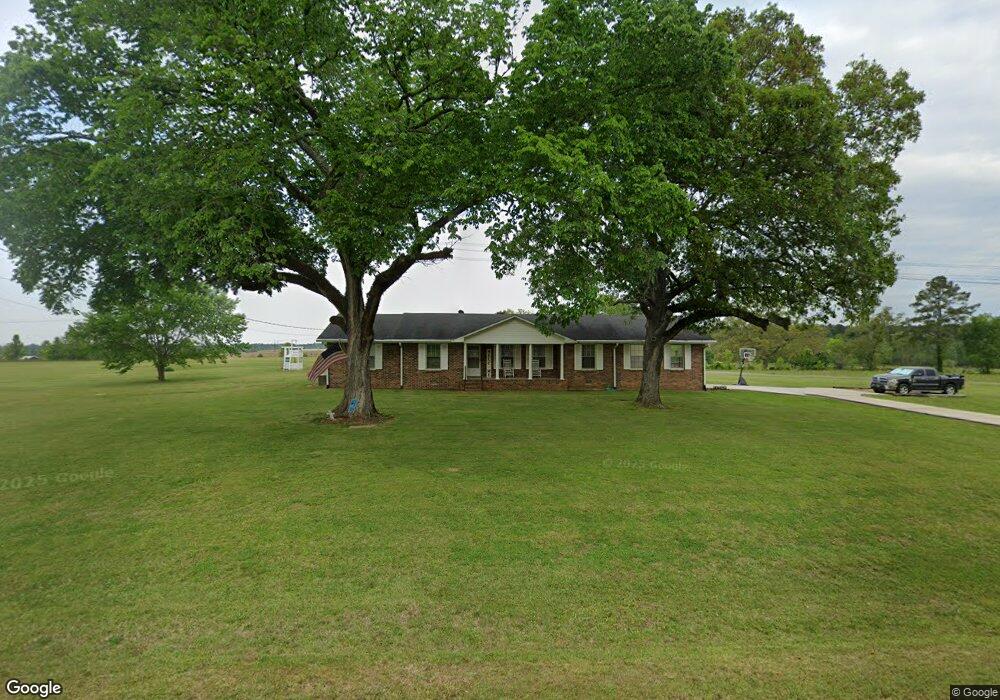
About This Home
This home is located at 4769 Blacks Bluff Rd SW, Rome, GA 30161 and is currently estimated at $318,083, approximately $158 per square foot. 4769 Blacks Bluff Rd SW is a home located in Floyd County with nearby schools including Coosa Middle School and Coosa High School.
Ownership History
Date
Name
Owned For
Owner Type
Purchase Details
Closed on
May 25, 2017
Sold by
Highfield Chance R
Bought by
Highfield Chance R and Highfield Heather M
Current Estimated Value
Home Financials for this Owner
Home Financials are based on the most recent Mortgage that was taken out on this home.
Original Mortgage
$145,500
Outstanding Balance
$121,059
Interest Rate
4.03%
Mortgage Type
New Conventional
Estimated Equity
$197,024
Purchase Details
Closed on
Jul 26, 2006
Sold by
Not Provided
Bought by
Knight V Joe
Home Financials for this Owner
Home Financials are based on the most recent Mortgage that was taken out on this home.
Original Mortgage
$147,682
Interest Rate
6.74%
Mortgage Type
New Conventional
Purchase Details
Closed on
Feb 23, 1978
Sold by
Couey C D
Bought by
Couey Couey C and Couey Limous Y
Purchase Details
Closed on
Nov 21, 1973
Bought by
Couey C D
Create a Home Valuation Report for This Property
The Home Valuation Report is an in-depth analysis detailing your home's value as well as a comparison with similar homes in the area
Home Values in the Area
Average Home Value in this Area
Purchase History
| Date | Buyer | Sale Price | Title Company |
|---|---|---|---|
| Highfield Chance R | -- | -- | |
| Highfield Chance R | $150,000 | -- | |
| Knight V Joe | $150,000 | -- | |
| Knight V Joe | -- | -- | |
| Couey Couey C | -- | -- | |
| Couey C D | $1,800 | -- |
Source: Public Records
Mortgage History
| Date | Status | Borrower | Loan Amount |
|---|---|---|---|
| Open | Highfield Chance R | $145,500 | |
| Closed | Highfield Chance R | $145,500 | |
| Previous Owner | Knight V Joe | $147,682 |
Source: Public Records
Tax History Compared to Growth
Tax History
| Year | Tax Paid | Tax Assessment Tax Assessment Total Assessment is a certain percentage of the fair market value that is determined by local assessors to be the total taxable value of land and additions on the property. | Land | Improvement |
|---|---|---|---|---|
| 2024 | $2,318 | $106,388 | $18,744 | $87,644 |
| 2023 | $2,334 | $102,527 | $17,040 | $85,487 |
| 2022 | $1,855 | $74,302 | $14,058 | $60,244 |
| 2021 | $1,646 | $61,140 | $12,794 | $48,346 |
| 2020 | $1,590 | $57,397 | $11,126 | $46,271 |
| 2019 | $1,533 | $55,289 | $11,126 | $44,163 |
| 2018 | $1,484 | $52,513 | $10,597 | $41,916 |
| 2017 | $1,302 | $43,203 | $9,812 | $33,391 |
| 2016 | $1,306 | $42,791 | $9,800 | $32,991 |
| 2015 | -- | $42,791 | $9,800 | $32,991 |
| 2014 | -- | $42,791 | $9,800 | $32,991 |
Source: Public Records
Map
Nearby Homes
- 0 Old Blacks Bluff Rd SW Unit 10652523
- 0 McGee Bend Rd SW Unit 10351960
- 47 Boyd Rd SW
- 3686 Blacks Bluff Rd SW
- 0 Ausburn Rd SW Unit 10611100
- 3428 Horseleg Creek Rd SW
- 3241 Horseleg Creek Rd SW
- 0 Blacks Bluff Rd SW Unit 17015073
- 5165 Cave Spring Rd SW
- 8876 Cave Spring
- 8876 Cave Spring Rd SW
- 0 Oakmont Dr SW Unit 10648261
- 458 Kraftsman Rd SW
- 0 Melson Rd SW Unit 7676052
- 0 Melson Rd SW Unit 10636997
- 0 Mill Rd Unit 10629874
- 0 Mill Rd Unit 7670319
- 4365 Cave Spring Rd SW
- 3 SW Highlander Trail SW
- 63 Highlander Trail SW
- 4738 Blacks Bluff Rd SW
- 4709 Blacks Bluff Rd SW
- 4668 Blacks Bluff Rd SW
- 4691 Blacks Bluff Rd SW
- 4819 Blacks Bluff Rd SW
- 4819 Blacks Bluff Rd SW
- 4759 Blacks Bluff Rd SW
- 4735 Blacks Bluff Rd SW
- 4609 Old Blacks Bluff Rd SW
- 4609 Old Blacks Bluff Rd SW
- 4865 Blacks Bluff Rd SW
- 4622 Blacks Bluff Rd SW
- 4622 Blacks Bluff Rd SW
- 4886 Blacks Bluff Rd SW
- 4575 Old Blacks Bluff Rd SW
- 4575 Old Blacks Bluff Rd SW
- 4575 Old Blacks Bluff Rd SW
- 4869 Blacks Bluff Rd SW
- 4898 Blacks Bluff Rd SW
- 4510 Blacks Bluff Rd SW