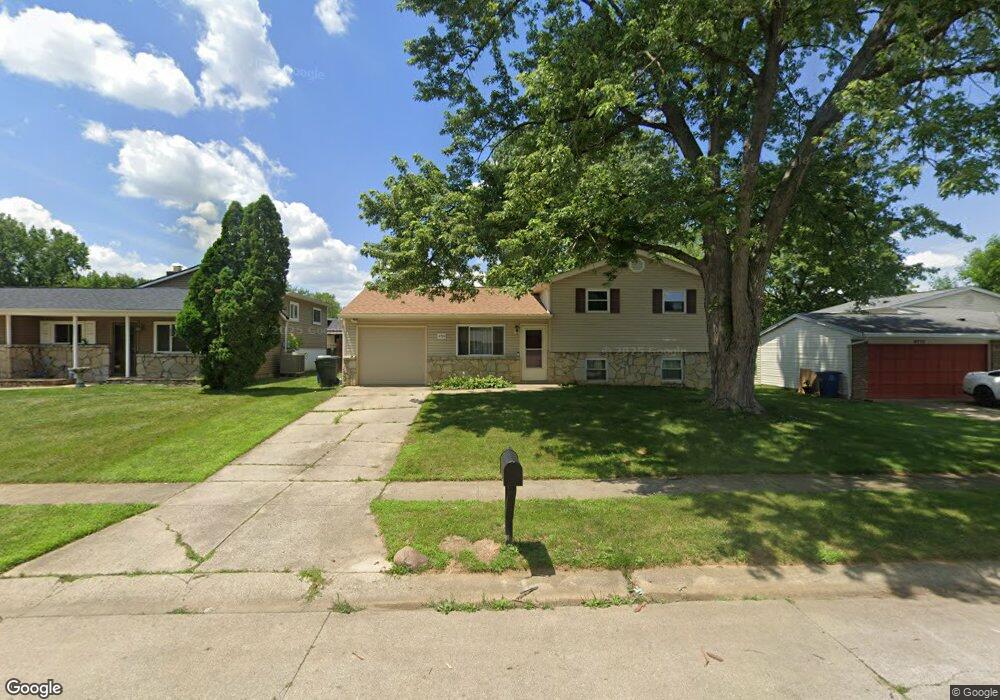
4769 Echorock Dr Columbus, OH 43231
Brandywine NeighborhoodEstimated Value: $256,362 - $293,000
3
Beds
2
Baths
1,378
Sq Ft
$198/Sq Ft
Est. Value
About This Home
This home is located at 4769 Echorock Dr, Columbus, OH 43231 and is currently estimated at $273,341, approximately $198 per square foot. 4769 Echorock Dr is a home located in Franklin County with nearby schools including Mark Twain Elementary School, Walnut Springs Middle School, and Westerville South High School.
Ownership History
Date
Name
Owned For
Owner Type
Purchase Details
Closed on
Apr 29, 2009
Sold by
Gregory Troy W and Gregory Kelly E
Bought by
Caslin Lakasha A and Caslin Lewis L
Current Estimated Value
Home Financials for this Owner
Home Financials are based on the most recent Mortgage that was taken out on this home.
Original Mortgage
$123,619
Outstanding Balance
$76,666
Interest Rate
4.83%
Mortgage Type
FHA
Estimated Equity
$196,675
Purchase Details
Closed on
Aug 31, 1999
Sold by
Ferrara Paul T and Ferrera Diana R
Bought by
Gregory Troy W and Gregory Kelly E
Home Financials for this Owner
Home Financials are based on the most recent Mortgage that was taken out on this home.
Original Mortgage
$98,091
Interest Rate
7.59%
Mortgage Type
FHA
Purchase Details
Closed on
Nov 1, 1991
Bought by
Ferrara Paul T and Ferrara Diana K
Purchase Details
Closed on
Nov 3, 1987
Create a Home Valuation Report for This Property
The Home Valuation Report is an in-depth analysis detailing your home's value as well as a comparison with similar homes in the area
Home Values in the Area
Average Home Value in this Area
Purchase History
| Date | Buyer | Sale Price | Title Company |
|---|---|---|---|
| Caslin Lakasha A | $125,900 | None Available | |
| Gregory Troy W | $98,900 | Transohio Title | |
| Ferrara Paul T | $75,000 | -- | |
| -- | $67,400 | -- |
Source: Public Records
Mortgage History
| Date | Status | Borrower | Loan Amount |
|---|---|---|---|
| Open | Caslin Lakasha A | $123,619 | |
| Closed | Gregory Troy W | $98,091 |
Source: Public Records
Tax History
| Year | Tax Paid | Tax Assessment Tax Assessment Total Assessment is a certain percentage of the fair market value that is determined by local assessors to be the total taxable value of land and additions on the property. | Land | Improvement |
|---|---|---|---|---|
| 2025 | $3,602 | $72,280 | $19,250 | $53,030 |
| 2024 | $3,602 | $72,280 | $19,250 | $53,030 |
| 2023 | $3,515 | $72,275 | $19,250 | $53,025 |
| 2022 | $2,734 | $42,910 | $10,500 | $32,410 |
| 2021 | $2,760 | $42,910 | $10,500 | $32,410 |
| 2020 | $2,751 | $42,910 | $10,500 | $32,410 |
| 2019 | $2,308 | $34,340 | $8,400 | $25,940 |
| 2018 | $2,377 | $34,340 | $8,400 | $25,940 |
| 2017 | $2,262 | $34,340 | $8,400 | $25,940 |
| 2016 | $2,493 | $34,520 | $7,880 | $26,640 |
| 2015 | $2,498 | $34,520 | $7,880 | $26,640 |
| 2014 | $2,500 | $34,520 | $7,880 | $26,640 |
| 2013 | $1,311 | $36,330 | $8,295 | $28,035 |
Source: Public Records
Map
Nearby Homes
- 4772 Harr Ct
- 2830 Minerva Ave
- 0 Chester Rd
- 4660 Glenhaven Dr
- 0 Abington Rd Unit 225045775
- 0 Abington Rd Unit 224031704
- 0 Abington Rd Unit 224031738
- 0 Abington Rd Unit 224031699
- 0 Abington Rd Unit 225045777
- 2901 Footloose Dr
- 2414 Taymouth Rd
- 4687 Larkhall Ln
- 2601 Brooklyn Rd
- 3001 Bretton Woods Dr
- 2594 Adda Ave
- 2655 Minerva Lake Rd
- 3069 Wallingford Ave
- 2251 Tuliptree Ave
- 4560 Stonehedge Rd
- 5177 Avalon Ave
- 4761 Echorock Dr
- 4777 Echorock Dr
- 4764 Harr Ct
- 2700 Bretton Woods Dr
- 2708 Bretton Woods Dr
- 2710 Bretton Woods Dr
- 2694 Bretton Woods Dr
- 2692 Bretton Woods Dr
- 4785 Echorock Dr
- 2688 Bretton Woods Dr
- 2686 Bretton Woods Dr
- 2693 Landsburn Dr
- 4766 Echorock Dr
- 2684 Bretton Woods Dr
- 4774 Echorock Dr
- 4758 Echorock Dr
- 2672 Bretton Woods Dr
- 2670 Bretton Woods Dr
- 2685 Landsburn Dr
- 2712 Bretton Woods Dr
Your Personal Tour Guide
Ask me questions while you tour the home.