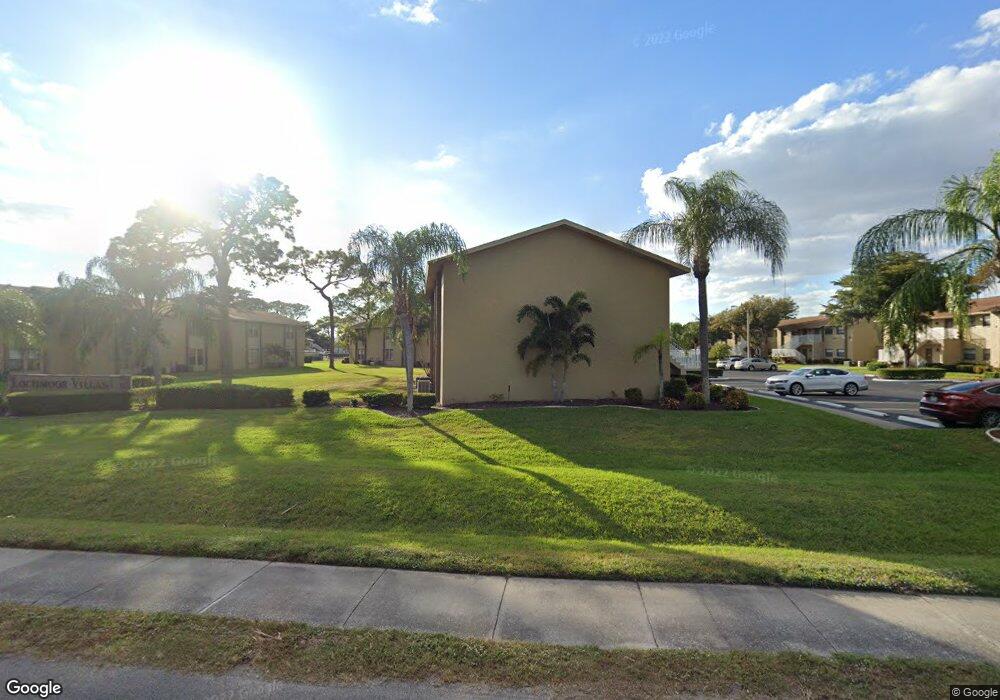
4769 Orange Grove Blvd Unit 3 North Fort Myers, FL 33903
Hancock NeighborhoodEstimated Value: $80,000 - $106,938
2
Beds
1
Bath
741
Sq Ft
$121/Sq Ft
Est. Value
About This Home
This home is located at 4769 Orange Grove Blvd Unit 3, North Fort Myers, FL 33903 and is currently estimated at $89,485, approximately $120 per square foot. 4769 Orange Grove Blvd Unit 3 is a home located in Lee County with nearby schools including Tropic Isles Elementary School, Hancock Creek Elementary School, and Caloosa Elementary School.
Ownership History
Date
Name
Owned For
Owner Type
Purchase Details
Closed on
Apr 1, 2025
Sold by
Fontz Steven T and Fontz Donna J
Bought by
Lapointe Mary Debra
Current Estimated Value
Purchase Details
Closed on
Feb 23, 2023
Sold by
Moomjian Wayne A
Bought by
Wayne A Moomjian Revocable Trust
Purchase Details
Closed on
Mar 30, 2020
Sold by
Miramar Street Llc
Bought by
Moomjian Wayne A
Purchase Details
Closed on
Dec 1, 2015
Sold by
Perkins Daniel W and Perkins Jacqueline A
Bought by
Miramar Street Llc
Purchase Details
Closed on
Oct 9, 2015
Sold by
Perkins Tara L and Frederick Gregory Maurice
Bought by
Perkins Daniel W and Perkins Jacqueline A
Purchase Details
Closed on
Dec 11, 2008
Sold by
C A P Properties Inc
Bought by
Perkins Tara L and Perkins Daniel W
Purchase Details
Closed on
Sep 2, 2004
Sold by
Hithersay Steve E and Hithersay Darcy M
Bought by
C A P Properties Inc
Create a Home Valuation Report for This Property
The Home Valuation Report is an in-depth analysis detailing your home's value as well as a comparison with similar homes in the area
Home Values in the Area
Average Home Value in this Area
Purchase History
| Date | Buyer | Sale Price | Title Company |
|---|---|---|---|
| Lapointe Mary Debra | $85,000 | Tropical Shells Title | |
| Wayne A Moomjian Revocable Trust | -- | -- | |
| Moomjian Wayne A | $82,500 | Florida Hometown T&E Llc | |
| Miramar Street Llc | -- | Attorney | |
| Perkins Daniel W | -- | Attorney | |
| Perkins Tara L | -- | None Available | |
| C A P Properties Inc | $65,500 | Furlong Title Company |
Source: Public Records
Tax History Compared to Growth
Tax History
| Year | Tax Paid | Tax Assessment Tax Assessment Total Assessment is a certain percentage of the fair market value that is determined by local assessors to be the total taxable value of land and additions on the property. | Land | Improvement |
|---|---|---|---|---|
| 2025 | $1,545 | $91,651 | -- | $91,651 |
| 2024 | $1,545 | $106,049 | -- | $106,049 |
| 2023 | $1,265 | $75,661 | $0 | $0 |
| 2022 | $1,093 | $68,783 | $0 | $0 |
| 2021 | $966 | $62,530 | $0 | $62,530 |
| 2020 | $888 | $56,525 | $0 | $56,525 |
| 2019 | $826 | $53,295 | $0 | $53,295 |
| 2018 | $755 | $46,835 | $0 | $46,835 |
| 2017 | $718 | $44,413 | $0 | $44,413 |
| 2016 | $610 | $37,936 | $0 | $37,936 |
| 2015 | $68 | $32,900 | $0 | $32,900 |
| 2014 | -- | $32,300 | $0 | $32,300 |
| 2013 | -- | $27,000 | $0 | $27,000 |
Source: Public Records
Map
Nearby Homes
- 4777 Orange Grove Blvd Unit 5
- 4728 Orange Grove Blvd Unit 8
- 4728 Orange Grove Blvd Unit 3
- 4344 Saint Clair Ave W
- 4380 Saint Clair Ave W
- 888 Ridgeway Dr
- 4562 Tennyson Dr
- 1707 Golf Club Dr Unit 3
- 4638 Vinsetta Ave
- 1003 Tropic Terrace
- 1010 Tropic Terrace
- 1699 Golf Club Dr Unit 7
- 5905 Untermeyer Ct
- 1432 Tropic Terrace Unit PS32
- 1416 Tropic Terrace
- 1429 Tropic Terrace
- 1409 Tropic Terrace
- 1418 Tropic Terrace
- 1521 Tropic Terrace
- 4555 Vinsetta Ave
- 4769 Orange Grove Blvd Unit 6
- 4769 Orange Grove Blvd Unit 1
- 4769 Orange Grove Blvd Unit 2
- 4769 Orange Grove Blvd Unit 4
- 4769 Orange Grove Blvd Unit 8
- 4769 Orange Grove Blvd Unit 7
- 4769 Orange Grove Blvd Unit 5
- 4773 Orange Grove Blvd Unit 6
- 4773 Orange Grove Blvd Unit 8
- 4773 Orange Grove Blvd Unit 3
- 4773 Orange Grove Blvd Unit 5
- 4773 Orange Grove Blvd Unit 2
- 4773 Orange Grove Blvd Unit 7
- 4773 Orange Grove Blvd Unit 4
- 4773 Orange Grove Blvd Unit 1
- 4757 Orange Grove Blvd Unit 1
- 4757 Orange Grove Blvd Unit 2
- 4757 Orange Grove Blvd Unit 6
- 4757 Orange Grove Blvd Unit 12
- 4757 Orange Grove Blvd Unit 8