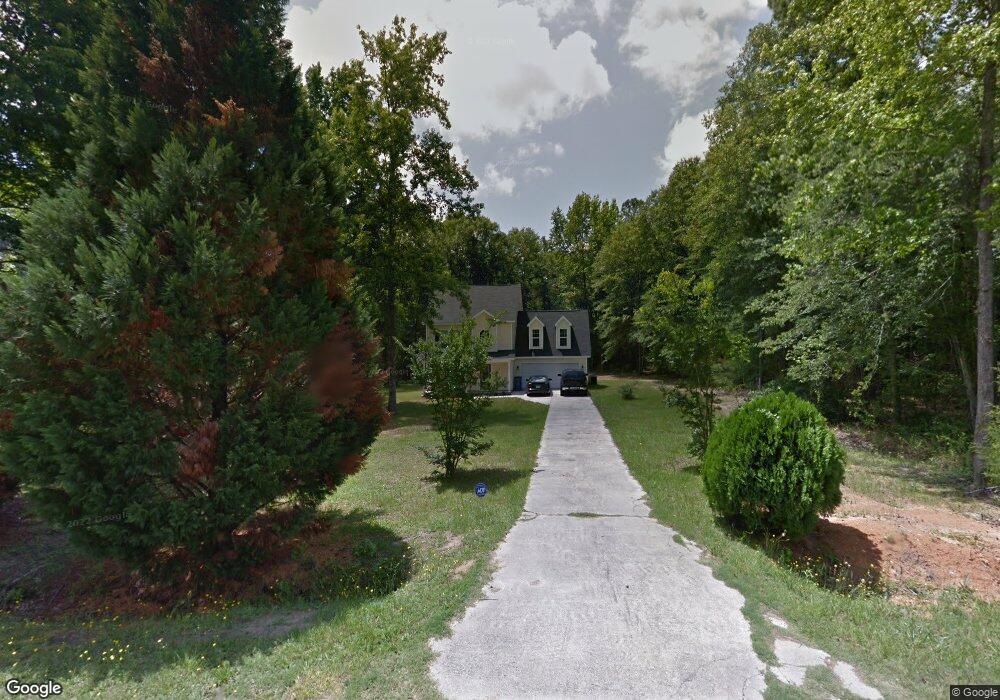
477 Carver St Thomson, GA 30824
Estimated Value: $228,000 - $324,000
4
Beds
3
Baths
1,751
Sq Ft
$156/Sq Ft
Est. Value
About This Home
This home is located at 477 Carver St, Thomson, GA 30824 and is currently estimated at $272,933, approximately $155 per square foot. 477 Carver St is a home located in McDuffie County with nearby schools including Thomson High School.
Ownership History
Date
Name
Owned For
Owner Type
Purchase Details
Closed on
Nov 2, 2011
Sold by
Lancaster Jimmy D
Bought by
Hart Vhelishia Shaunquenett
Current Estimated Value
Home Financials for this Owner
Home Financials are based on the most recent Mortgage that was taken out on this home.
Original Mortgage
$125,800
Outstanding Balance
$91,813
Interest Rate
4.02%
Mortgage Type
USDA
Estimated Equity
$181,120
Purchase Details
Closed on
Aug 5, 2011
Sold by
Mcduffie Builders
Bought by
Lancaster Jimmy D
Home Financials for this Owner
Home Financials are based on the most recent Mortgage that was taken out on this home.
Original Mortgage
$95,323
Interest Rate
4.62%
Mortgage Type
Unknown
Purchase Details
Closed on
Apr 5, 2011
Sold by
Usda Rural Development
Bought by
Mcduffie Builders
Purchase Details
Closed on
May 1, 1990
Bought by
Brinkley Brenda
Create a Home Valuation Report for This Property
The Home Valuation Report is an in-depth analysis detailing your home's value as well as a comparison with similar homes in the area
Home Values in the Area
Average Home Value in this Area
Purchase History
| Date | Buyer | Sale Price | Title Company |
|---|---|---|---|
| Hart Vhelishia Shaunquenett | $125,800 | -- | |
| Lancaster Jimmy D | -- | -- | |
| Mcduffie Builders | $5,735 | -- | |
| Brinkley Brenda | $43,500 | -- |
Source: Public Records
Mortgage History
| Date | Status | Borrower | Loan Amount |
|---|---|---|---|
| Open | Hart Vhelishia Shaunquenett | $125,800 | |
| Previous Owner | Lancaster Jimmy D | $95,323 |
Source: Public Records
Tax History Compared to Growth
Tax History
| Year | Tax Paid | Tax Assessment Tax Assessment Total Assessment is a certain percentage of the fair market value that is determined by local assessors to be the total taxable value of land and additions on the property. | Land | Improvement |
|---|---|---|---|---|
| 2024 | $2,118 | $91,016 | $3,400 | $87,616 |
| 2023 | $2,118 | $86,486 | $2,400 | $84,086 |
| 2022 | $1,933 | $76,173 | $2,400 | $73,773 |
| 2021 | $1,536 | $59,859 | $2,400 | $57,459 |
| 2020 | $1,315 | $50,633 | $2,000 | $48,633 |
| 2019 | $1,329 | $50,633 | $2,000 | $48,633 |
| 2018 | $1,329 | $50,633 | $2,000 | $48,633 |
| 2017 | $1,282 | $50,633 | $2,000 | $48,633 |
| 2016 | $1,282 | $50,633 | $2,000 | $48,633 |
| 2015 | $1,168 | $50,633 | $2,000 | $48,633 |
| 2014 | $1,175 | $50,809 | $2,000 | $48,809 |
| 2013 | -- | $55,940 | $2,000 | $53,940 |
Source: Public Records
Map
Nearby Homes
- 0 Liberty St
- 421 Liberty St
- 651 Moose Club Rd
- 1086 Boneville Rd
- 2592 White Oak Rd
- 139 Margarets Rd
- 219 Devonshire Dr
- 1463 Lokey Dr
- 563 Lakewood Dr
- 705 Marshall Church Rd
- 146 Willow Oak Cir
- 137 Willow Oak Cir
- 122 Willow Oak Cir
- 123 Willow Oak Cir
- 125 Willow Oak Cir
- A-00 Harrison Rd
- 1302 Elias Station
- 1290 Elias Station
- 1379 Elias Station
- 1283 Elias Station