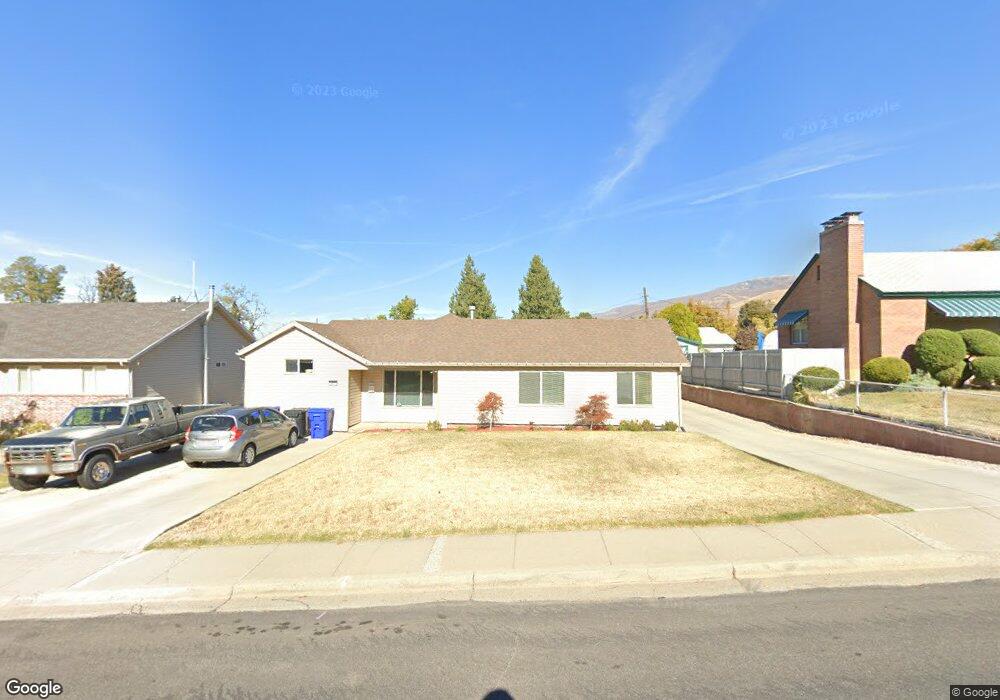
477 E 1500 S Bountiful, UT 84010
Estimated Value: $532,000 - $563,000
4
Beds
2
Baths
1,807
Sq Ft
$303/Sq Ft
Est. Value
About This Home
This home is located at 477 E 1500 S, Bountiful, UT 84010 and is currently estimated at $547,194, approximately $302 per square foot. 477 E 1500 S is a home located in Davis County with nearby schools including Valley View School, Millcreek Junior High School, and Bountiful High School.
Ownership History
Date
Name
Owned For
Owner Type
Purchase Details
Closed on
May 30, 2023
Sold by
Christensen Jay K
Bought by
Alicia And Jay Christensen Living Trust
Current Estimated Value
Purchase Details
Closed on
Jun 19, 2020
Sold by
Purcell Alicia G
Bought by
Christensen Jay K and Christensen Alicia G
Home Financials for this Owner
Home Financials are based on the most recent Mortgage that was taken out on this home.
Original Mortgage
$186,815
Interest Rate
2.8%
Mortgage Type
New Conventional
Purchase Details
Closed on
Feb 18, 2010
Sold by
Purcell Jon R
Bought by
Purcell Alicia G
Home Financials for this Owner
Home Financials are based on the most recent Mortgage that was taken out on this home.
Original Mortgage
$235,550
Interest Rate
4.38%
Mortgage Type
New Conventional
Create a Home Valuation Report for This Property
The Home Valuation Report is an in-depth analysis detailing your home's value as well as a comparison with similar homes in the area
Purchase History
| Date | Buyer | Sale Price | Title Company |
|---|---|---|---|
| Alicia And Jay Christensen Living Trust | -- | None Listed On Document | |
| Christensen Jay K | -- | Unear Title Agency Of Ut | |
| Purcell Alicia G | -- | Highland Title Agency Inc |
Source: Public Records
Mortgage History
| Date | Status | Borrower | Loan Amount |
|---|---|---|---|
| Previous Owner | Christensen Jay K | $186,815 | |
| Previous Owner | Purcell Alicia G | $235,550 |
Source: Public Records
Tax History
| Year | Tax Paid | Tax Assessment Tax Assessment Total Assessment is a certain percentage of the fair market value that is determined by local assessors to be the total taxable value of land and additions on the property. | Land | Improvement |
|---|---|---|---|---|
| 2025 | $3,194 | $290,400 | $135,003 | $155,397 |
| 2024 | $2,983 | $281,050 | $121,441 | $159,609 |
| 2023 | $3,059 | $525,000 | $222,703 | $302,297 |
| 2022 | $3,214 | $303,050 | $121,414 | $181,636 |
| 2021 | $2,721 | $391,000 | $158,929 | $232,071 |
| 2020 | $2,409 | $347,000 | $135,382 | $211,618 |
| 2019 | $2,390 | $336,000 | $140,424 | $195,576 |
| 2018 | $2,234 | $309,000 | $137,592 | $171,408 |
| 2016 | $1,976 | $143,825 | $53,222 | $90,603 |
| 2015 | $1,896 | $134,035 | $53,222 | $80,813 |
| 2014 | $2,025 | $143,830 | $53,222 | $90,608 |
| 2013 | -- | $115,169 | $51,700 | $63,469 |
Source: Public Records
Map
Nearby Homes
- 380 E 1500 S
- 631 E 1700 S
- 288 E 1650 S
- 795 Abby Ln Unit 5
- 1761 S Davis Blvd
- 285 E 1100 S
- 775 E 1500 S
- 141 E 1650 S
- 1886 S Jeri Dr
- 861 E Millbrook Way
- 2059 S 350 E Unit 6
- 2038 S 350 E Unit 3
- 295 E 2050 S Unit 1
- 2046 S 350 E Unit 4
- 2053 S 350 E Unit 7
- 296 E 2050 S Unit 2
- 323 Peach Ln
- 188 E 2050 S Unit D3
- 320 E 2100 S
- 275 E Peach Ln S
Your Personal Tour Guide
Ask me questions while you tour the home.