Estimated Value: $131,000 - $141,804
3
Beds
1
Bath
1,584
Sq Ft
$87/Sq Ft
Est. Value
About This Home
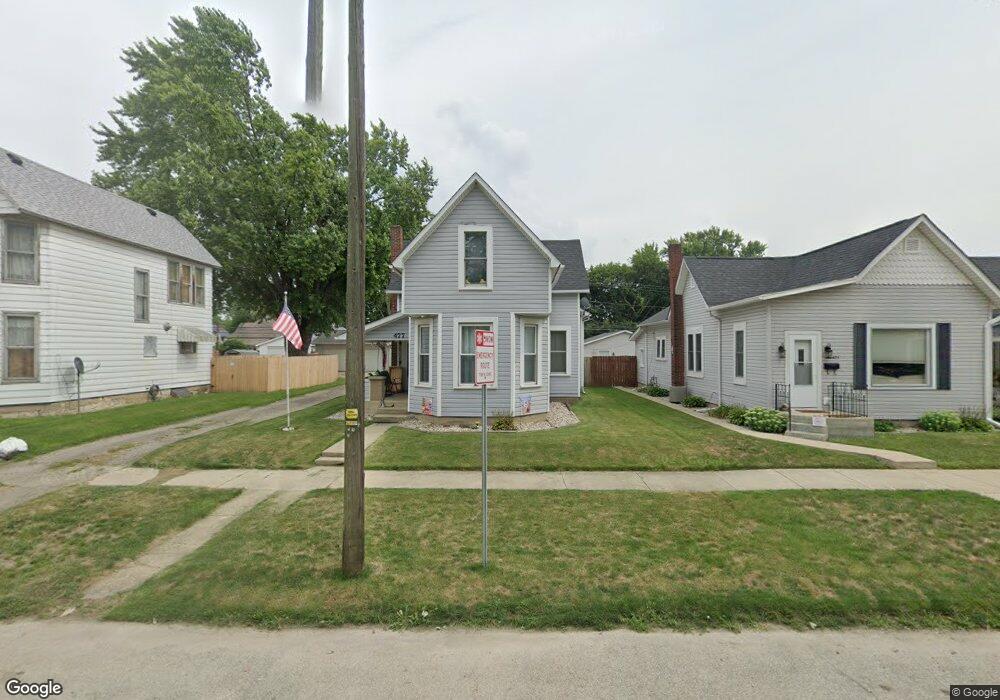
This home is located at 477 E Main St, Peru, IN 46970 and is currently estimated at $137,201, approximately $86 per square foot. 477 E Main St is a home located in Miami County with nearby schools including Elmwood Primary Learning Center, Blair Pointe Upper Elementary School, and Peru Junior/High School.
Ownership History
Date
Name
Owned For
Owner Type
Purchase Details
Closed on
May 20, 2011
Sold by
Fisher Charles S and Fisher Jill Kay
Bought by
Miller Bruce D
Current Estimated Value
Home Financials for this Owner
Home Financials are based on the most recent Mortgage that was taken out on this home.
Original Mortgage
$64,170
Outstanding Balance
$43,859
Interest Rate
4.91%
Mortgage Type
New Conventional
Estimated Equity
$93,342
Purchase Details
Closed on
Feb 16, 2011
Sold by
Deutsche Bank National Trust Co
Bought by
Fisher Charles S and Fisher Jill Kay
Purchase Details
Closed on
May 18, 2010
Sold by
Garbert Edward E and Garbert Peggy L
Bought by
Deutsche Bank National Trust Co
Create a Home Valuation Report for This Property
The Home Valuation Report is an in-depth analysis detailing your home's value as well as a comparison with similar homes in the area
Home Values in the Area
Average Home Value in this Area
Purchase History
| Date | Buyer | Sale Price | Title Company |
|---|---|---|---|
| Miller Bruce D | -- | None Available | |
| Fisher Charles S | -- | None Available | |
| Deutsche Bank National Trust Co | $22,000 | None Available |
Source: Public Records
Mortgage History
| Date | Status | Borrower | Loan Amount |
|---|---|---|---|
| Open | Miller Bruce D | $64,170 |
Source: Public Records
Tax History
| Year | Tax Paid | Tax Assessment Tax Assessment Total Assessment is a certain percentage of the fair market value that is determined by local assessors to be the total taxable value of land and additions on the property. | Land | Improvement |
|---|---|---|---|---|
| 2025 | $829 | $112,800 | $5,100 | $107,700 |
| 2024 | $829 | $82,900 | $5,100 | $77,800 |
| 2023 | $829 | $80,400 | $5,100 | $75,300 |
| 2022 | $748 | $80,400 | $5,100 | $75,300 |
| 2021 | $652 | $73,900 | $5,100 | $68,800 |
| 2020 | $610 | $74,300 | $5,100 | $69,200 |
| 2019 | $644 | $74,300 | $5,100 | $69,200 |
| 2018 | $504 | $64,500 | $5,100 | $59,400 |
| 2017 | $1,286 | $64,300 | $5,200 | $59,100 |
| 2016 | $1,288 | $64,400 | $5,200 | $59,200 |
| 2014 | $1,270 | $63,500 | $5,200 | $58,300 |
| 2013 | -- | $63,500 | $5,200 | $58,300 |
Source: Public Records
Map
Nearby Homes
Your Personal Tour Guide
Ask me questions while you tour the home.