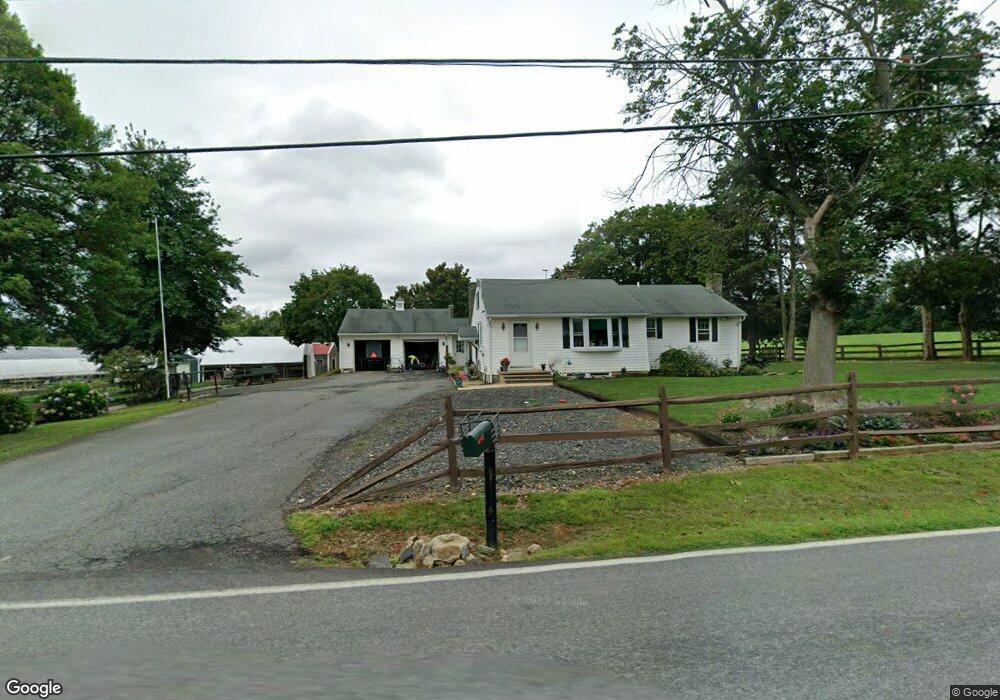
477 Ebenezer Church Rd Rising Sun, MD 21911
Estimated Value: $311,000 - $394,000
--
Bed
2
Baths
1,482
Sq Ft
$239/Sq Ft
Est. Value
About This Home
This home is located at 477 Ebenezer Church Rd, Rising Sun, MD 21911 and is currently estimated at $354,603, approximately $239 per square foot. 477 Ebenezer Church Rd is a home located in Cecil County with nearby schools including Bay View Elementary School, North East Middle School, and North East High School.
Ownership History
Date
Name
Owned For
Owner Type
Purchase Details
Closed on
Sep 3, 2021
Sold by
Davis Karen B and Bailiff David B
Bought by
Yoder Christian S and Yoder Sallie K
Current Estimated Value
Home Financials for this Owner
Home Financials are based on the most recent Mortgage that was taken out on this home.
Original Mortgage
$220,000
Outstanding Balance
$200,184
Interest Rate
2.8%
Mortgage Type
Purchase Money Mortgage
Estimated Equity
$154,419
Purchase Details
Closed on
Feb 12, 2020
Sold by
Linthicum Paul and Linthicum Donn M
Bought by
Carter Foots Linda L
Home Financials for this Owner
Home Financials are based on the most recent Mortgage that was taken out on this home.
Original Mortgage
$80,300
Interest Rate
3.72%
Mortgage Type
Purchase Money Mortgage
Purchase Details
Closed on
Mar 6, 2014
Sold by
Bailiff Theodore
Bought by
Bailiff Theodore
Purchase Details
Closed on
Apr 28, 2010
Sold by
Bailiff Kay P and Bailiff Theodore
Bought by
Davis Karen B and Bailiff David M
Create a Home Valuation Report for This Property
The Home Valuation Report is an in-depth analysis detailing your home's value as well as a comparison with similar homes in the area
Home Values in the Area
Average Home Value in this Area
Purchase History
| Date | Buyer | Sale Price | Title Company |
|---|---|---|---|
| Yoder Christian S | $275,000 | Kirsh Title Services Inc | |
| Carter Foots Linda L | $52,000 | Liberty Title Services Llc | |
| Bailiff Theodore | -- | None Available | |
| Davis Karen B | -- | -- |
Source: Public Records
Mortgage History
| Date | Status | Borrower | Loan Amount |
|---|---|---|---|
| Open | Yoder Christian S | $220,000 | |
| Previous Owner | Carter Foots Linda L | $80,300 |
Source: Public Records
Tax History Compared to Growth
Tax History
| Year | Tax Paid | Tax Assessment Tax Assessment Total Assessment is a certain percentage of the fair market value that is determined by local assessors to be the total taxable value of land and additions on the property. | Land | Improvement |
|---|---|---|---|---|
| 2025 | $3,000 | $268,600 | $0 | $0 |
| 2024 | $2,447 | $250,100 | $0 | $0 |
| 2023 | $1,918 | $231,600 | $104,200 | $127,400 |
| 2022 | $2,643 | $229,367 | $0 | $0 |
| 2021 | $2,590 | $227,133 | $0 | $0 |
| 2020 | $5,237 | $224,900 | $104,200 | $120,700 |
| 2019 | $2,523 | $218,767 | $0 | $0 |
| 2018 | $2,442 | $212,633 | $0 | $0 |
| 2017 | $2,300 | $206,500 | $0 | $0 |
| 2016 | $2,260 | $203,000 | $0 | $0 |
| 2015 | $2,260 | $199,500 | $0 | $0 |
| 2014 | $2,410 | $196,000 | $0 | $0 |
Source: Public Records
Map
Nearby Homes
- 91 Bard Cameron Rd
- 341 Goosemar Rd
- 118 Oleary Ln
- 148 Sharon St
- 2335 Theodore Rd
- 145 Bethel Springs Dr
- 424 Bailiff Rd
- 74 Ayers Dr
- 116 Bethel Springs Dr
- 327 Barney Ct
- Frankford Plan at Stoney Creek
- Raleigh Plan at Stoney Creek
- Salem Plan at Stoney Creek
- Nottingham Plan at Stoney Creek
- Rehoboth Plan at Stoney Creek
- Roosevelt Plan at Stoney Creek
- Bristol II Plan at Stoney Creek
- Hamilton Plan at Stoney Creek
- Sussex Plan at Stoney Creek
- Jefferson Plan at Stoney Creek