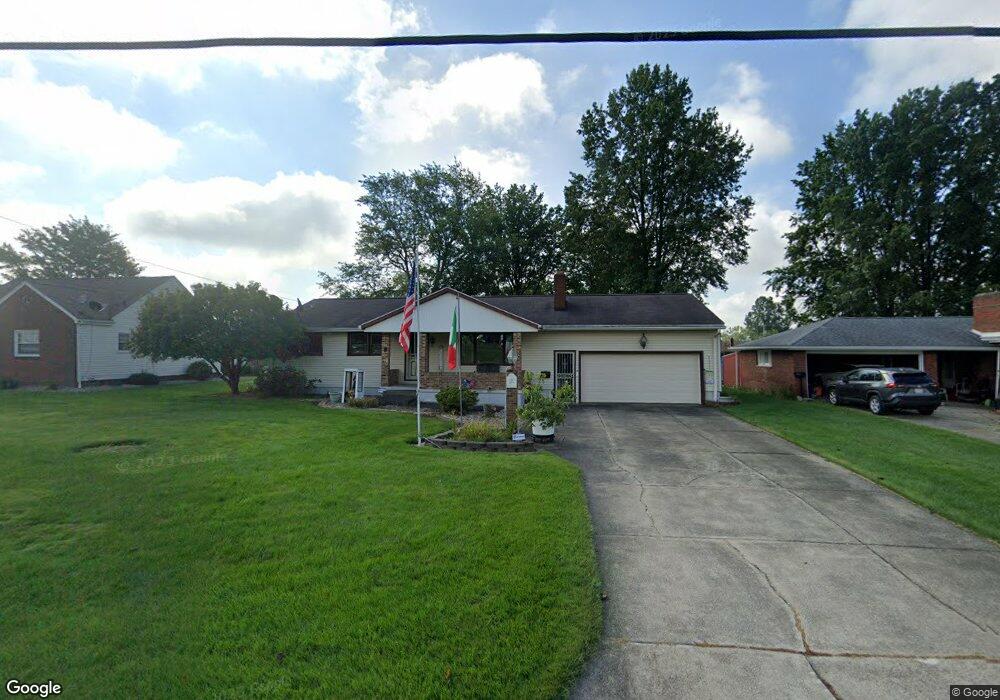
477 Elizabeth Ln Campbell, OH 44405
Estimated Value: $163,067 - $180,000
3
Beds
1
Bath
1,176
Sq Ft
$146/Sq Ft
Est. Value
About This Home
This home is located at 477 Elizabeth Ln, Campbell, OH 44405 and is currently estimated at $172,017, approximately $146 per square foot. 477 Elizabeth Ln is a home located in Mahoning County with nearby schools including Campbell Elementary School, Memorial High School, and Northeast Ohio Impact Academy.
Ownership History
Date
Name
Owned For
Owner Type
Purchase Details
Closed on
Jun 11, 2025
Sold by
Matash Louise P
Bought by
Gentsy Anthony Michael
Current Estimated Value
Home Financials for this Owner
Home Financials are based on the most recent Mortgage that was taken out on this home.
Original Mortgage
$197,149
Outstanding Balance
$196,638
Interest Rate
6.76%
Mortgage Type
VA
Estimated Equity
-$24,621
Purchase Details
Closed on
May 3, 1962
Bought by
Matash Anthony P
Create a Home Valuation Report for This Property
The Home Valuation Report is an in-depth analysis detailing your home's value as well as a comparison with similar homes in the area
Home Values in the Area
Average Home Value in this Area
Purchase History
| Date | Buyer | Sale Price | Title Company |
|---|---|---|---|
| Gentsy Anthony Michael | $193,000 | None Listed On Document | |
| Matash Anthony P | -- | -- |
Source: Public Records
Mortgage History
| Date | Status | Borrower | Loan Amount |
|---|---|---|---|
| Open | Gentsy Anthony Michael | $197,149 |
Source: Public Records
Tax History Compared to Growth
Tax History
| Year | Tax Paid | Tax Assessment Tax Assessment Total Assessment is a certain percentage of the fair market value that is determined by local assessors to be the total taxable value of land and additions on the property. | Land | Improvement |
|---|---|---|---|---|
| 2024 | $1,611 | $40,460 | $3,160 | $37,300 |
| 2023 | $1,624 | $40,460 | $3,160 | $37,300 |
| 2022 | $1,257 | $29,010 | $3,160 | $25,850 |
| 2021 | $1,176 | $29,010 | $3,160 | $25,850 |
| 2020 | $1,194 | $29,010 | $3,160 | $25,850 |
| 2019 | $1,045 | $24,520 | $3,160 | $21,360 |
| 2018 | $1,070 | $24,520 | $3,160 | $21,360 |
| 2017 | $1,102 | $24,520 | $3,160 | $21,360 |
| 2016 | $1,136 | $26,510 | $3,160 | $23,350 |
| 2015 | $1,113 | $26,510 | $3,160 | $23,350 |
| 2014 | $1,110 | $26,510 | $3,160 | $23,350 |
| 2013 | $1,088 | $26,510 | $3,160 | $23,350 |
Source: Public Records
Map
Nearby Homes