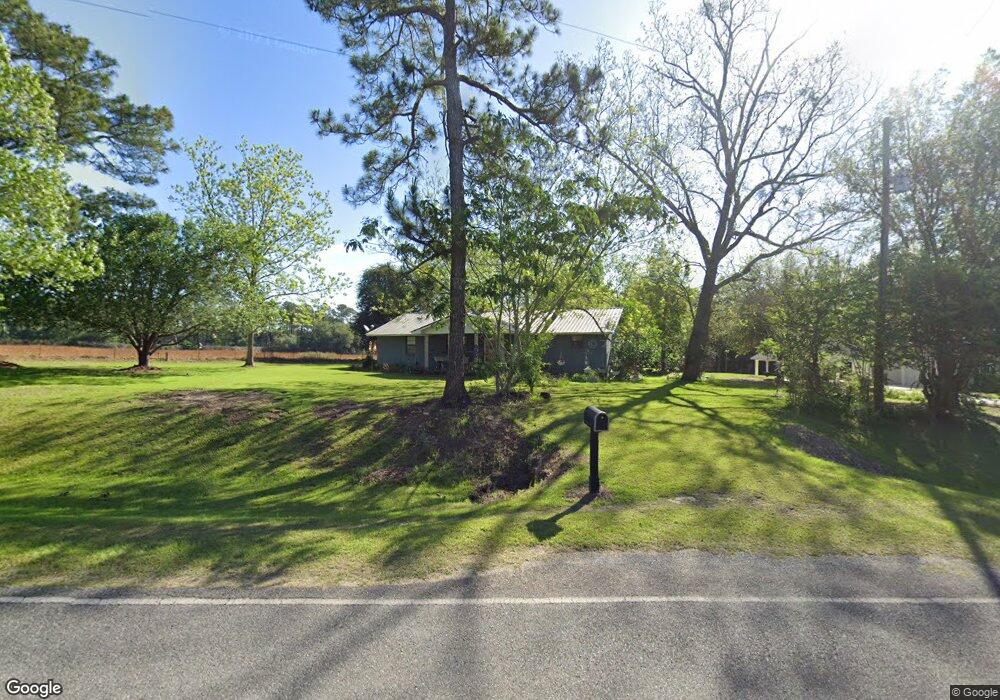
477 Fred Webb Rd Moultrie, GA 31768
Estimated Value: $90,748 - $136,000
Studio
2
Baths
1,728
Sq Ft
$71/Sq Ft
Est. Value
About This Home
This home is located at 477 Fred Webb Rd, Moultrie, GA 31768 and is currently estimated at $121,937, approximately $70 per square foot. 477 Fred Webb Rd is a home located in Colquitt County with nearby schools including Sunset Elementary School, Willie J. Williams Middle School, and C.A. Gray Junior High School.
Ownership History
Date
Name
Owned For
Owner Type
Purchase Details
Closed on
Apr 24, 2025
Sold by
Harrod Holly Richmond
Bought by
Calhoun Larue
Current Estimated Value
Purchase Details
Closed on
Jan 23, 2024
Sold by
Tillman Annette E
Bought by
Tillman Clay Elrod
Purchase Details
Closed on
May 11, 2010
Sold by
Tillman Annette E
Bought by
Tillman Annette E and Harrod Holly Richmond
Purchase Details
Closed on
Feb 24, 2010
Sold by
Calhoun Larue
Bought by
Tillman Annette E
Home Financials for this Owner
Home Financials are based on the most recent Mortgage that was taken out on this home.
Original Mortgage
$35,795
Interest Rate
4.97%
Mortgage Type
Future Advance Clause Open End Mortgage
Purchase Details
Closed on
May 1, 2003
Sold by
Elrod Alberta C Life Est
Bought by
Elrod Alberta C
Purchase Details
Closed on
Apr 7, 1997
Bought by
Elrod Alberta C Life Est
Create a Home Valuation Report for This Property
The Home Valuation Report is an in-depth analysis detailing your home's value as well as a comparison with similar homes in the area
Purchase History
| Date | Buyer | Sale Price | Title Company |
|---|---|---|---|
| Calhoun Larue | $49,054 | -- | |
| Tillman Clay Elrod | -- | -- | |
| Tillman Annette E | -- | -- | |
| Tillman Annette E | $35,000 | -- | |
| Elrod Alberta C | $15,000 | -- | |
| Elrod Alberta C Life Est | $15,200 | -- |
Source: Public Records
Mortgage History
| Date | Status | Borrower | Loan Amount |
|---|---|---|---|
| Previous Owner | Tillman Annette E | $35,795 |
Source: Public Records
Tax History
| Year | Tax Paid | Tax Assessment Tax Assessment Total Assessment is a certain percentage of the fair market value that is determined by local assessors to be the total taxable value of land and additions on the property. | Land | Improvement |
|---|---|---|---|---|
| 2025 | $384 | $19,285 | $1,938 | $17,347 |
| 2024 | $384 | $19,621 | $1,453 | $18,168 |
| 2023 | $372 | $12,705 | $1,453 | $11,252 |
| 2022 | $248 | $12,410 | $1,292 | $11,118 |
| 2021 | $290 | $13,930 | $1,292 | $12,638 |
| 2020 | $278 | $13,242 | $1,292 | $11,950 |
| 2019 | $312 | $13,357 | $1,292 | $12,065 |
| 2018 | $342 | $13,357 | $1,292 | $12,065 |
| 2017 | $330 | $14,107 | $2,042 | $12,065 |
| 2016 | $334 | $14,107 | $2,042 | $12,065 |
| 2015 | $337 | $14,107 | $2,042 | $12,065 |
| 2014 | $331 | $14,107 | $2,042 | $12,065 |
| 2013 | -- | $14,107 | $2,042 | $12,064 |
Source: Public Records
Map
Nearby Homes
- 164 Giles Rd
- 303 Vinland Cir
- 2781 Kendallwood Church Rd
- 135 Southlake Dr
- 387 Tanglewood Dr
- 205 Will Rd
- 117 Will Rd
- XX Us Highway 319 S Unit 8-11
- 534 Us Highway 319 S
- 00 Ragin Rd Unit 7
- 00 Ragin Rd Unit 12
- xx Ga Hwy 319 N
- 305 Clubview Dr
- 304 Clubview Dr
- 1894 Georgia 111
- 186 Fireplace Ln
- 206 Baell Trace Ct
- 96 Baell Trace Ct SE
- 110 Baell Trace Ct SE
- 126 Sunset Cir
- 495 Fred Webb Rd
- 484 Fred Webb Rd
- 508 Fred Webb Rd
- 525 Fred Webb Rd
- 408 Fred Webb Rd
- 552 Fred Webb Rd
- 191 Giles Rd
- 207 Giles Rd
- 323 Fred Webb Rd
- 354 Fred Webb Rd
- 248 Giles Rd
- 260 Giles Rd
- 659 Fred Webb Rd
- 280 Giles Rd
- 290 Giles Rd
- 308 Giles Rd
- 699 Fred Webb Rd
- 674 Fred Webb Rd
- 740 Fred Webb Rd
- 781 Fred Webb Rd
Your Personal Tour Guide
Ask me questions while you tour the home.