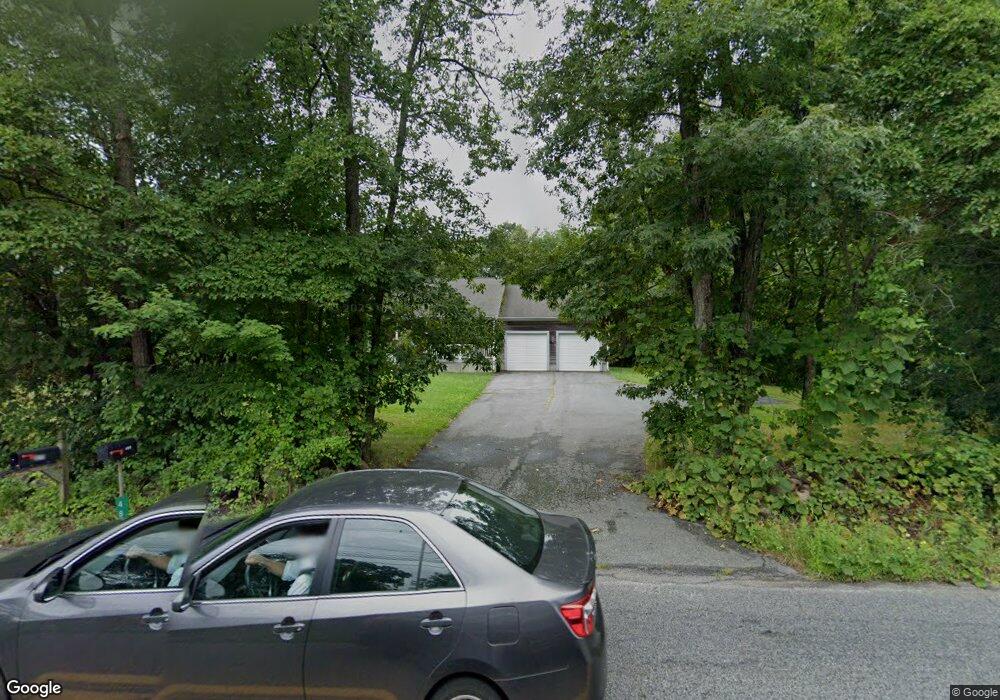
477 Gifford Rd Westport, MA 02790
North Westport NeighborhoodEstimated Value: $584,000 - $775,000
3
Beds
--
Bath
1,952
Sq Ft
$360/Sq Ft
Est. Value
About This Home
This home is located at 477 Gifford Rd, Westport, MA 02790 and is currently estimated at $703,502, approximately $360 per square foot. 477 Gifford Rd is a home located in Bristol County with nearby schools including Alice A. Macomber Primary School, Westport Elementary School, and Westport Middle-High School.
Ownership History
Date
Name
Owned For
Owner Type
Purchase Details
Closed on
Jul 28, 2006
Sold by
Pavao Re Inc
Bought by
Cadime Jeffrey P and Cadime Lisa E
Current Estimated Value
Home Financials for this Owner
Home Financials are based on the most recent Mortgage that was taken out on this home.
Original Mortgage
$160,000
Outstanding Balance
$95,591
Interest Rate
6.67%
Mortgage Type
Purchase Money Mortgage
Estimated Equity
$607,911
Purchase Details
Closed on
Apr 18, 2006
Sold by
Mello Alfred J and Mello Christopher A
Bought by
Pavao Re Inc
Create a Home Valuation Report for This Property
The Home Valuation Report is an in-depth analysis detailing your home's value as well as a comparison with similar homes in the area
Home Values in the Area
Average Home Value in this Area
Purchase History
| Date | Buyer | Sale Price | Title Company |
|---|---|---|---|
| Cadime Jeffrey P | $200,000 | -- | |
| Pavao Re Inc | $165,000 | -- |
Source: Public Records
Mortgage History
| Date | Status | Borrower | Loan Amount |
|---|---|---|---|
| Open | Pavao Re Inc | $160,000 |
Source: Public Records
Tax History Compared to Growth
Tax History
| Year | Tax Paid | Tax Assessment Tax Assessment Total Assessment is a certain percentage of the fair market value that is determined by local assessors to be the total taxable value of land and additions on the property. | Land | Improvement |
|---|---|---|---|---|
| 2025 | $4,569 | $613,300 | $178,300 | $435,000 |
| 2024 | $4,541 | $587,400 | $158,300 | $429,100 |
| 2023 | $4,331 | $530,800 | $144,200 | $386,600 |
| 2022 | $4,013 | $473,200 | $144,200 | $329,000 |
| 2021 | $3,863 | $448,200 | $119,200 | $329,000 |
| 2020 | $3,738 | $443,400 | $114,400 | $329,000 |
| 2019 | $3,727 | $450,700 | $114,400 | $336,300 |
| 2018 | $3,239 | $396,500 | $114,300 | $282,200 |
| 2017 | $3,060 | $383,900 | $110,700 | $273,200 |
| 2016 | $2,806 | $354,800 | $107,000 | $247,800 |
| 2015 | $2,610 | $329,100 | $109,400 | $219,700 |
Source: Public Records
Map
Nearby Homes