477 Hammond St Corning, NY 14830
Estimated Value: $134,000 - $152,000
3
Beds
2
Baths
1,747
Sq Ft
$81/Sq Ft
Est. Value
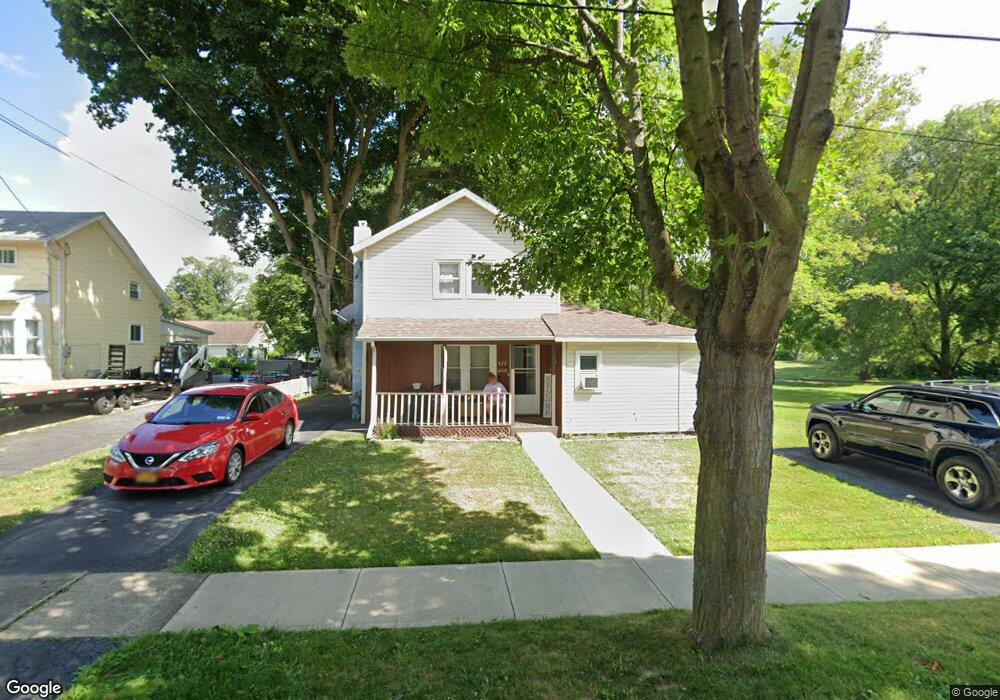
About This Home
This home is located at 477 Hammond St, Corning, NY 14830 and is currently estimated at $141,237, approximately $80 per square foot. 477 Hammond St is a home located in Steuben County with nearby schools including William E. Severn Elementary School, Corning-Painted Post Middle School, and Corning-Painted Post High School.
Ownership History
Date
Name
Owned For
Owner Type
Purchase Details
Closed on
Jul 3, 2002
Sold by
Gleason Carlton F
Bought by
Strong Edward B
Current Estimated Value
Purchase Details
Closed on
Oct 24, 2001
Sold by
Savings Bank Of The
Bought by
Gleason Carlton F
Purchase Details
Closed on
Aug 23, 2001
Purchase Details
Closed on
May 1, 1998
Sold by
Hammer James
Bought by
Sherwood Steven P and Abbey Sonya
Purchase Details
Closed on
Feb 26, 1998
Sold by
Hammer James
Bought by
Sherwood Steven P and Abbey Sonya
Create a Home Valuation Report for This Property
The Home Valuation Report is an in-depth analysis detailing your home's value as well as a comparison with similar homes in the area
Home Values in the Area
Average Home Value in this Area
Purchase History
| Date | Buyer | Sale Price | Title Company |
|---|---|---|---|
| Strong Edward B | $44,700 | Scott Moore | |
| Gleason Carlton F | $21,500 | -- | |
| -- | $20,000 | -- | |
| Sherwood Steven P | $47,000 | -- | |
| Sherwood Steven P | $47,000 | -- |
Source: Public Records
Tax History Compared to Growth
Tax History
| Year | Tax Paid | Tax Assessment Tax Assessment Total Assessment is a certain percentage of the fair market value that is determined by local assessors to be the total taxable value of land and additions on the property. | Land | Improvement |
|---|---|---|---|---|
| 2024 | $2,883 | $105,000 | $13,000 | $92,000 |
| 2023 | $2,915 | $105,000 | $13,000 | $92,000 |
| 2022 | $3,669 | $78,000 | $8,200 | $69,800 |
| 2021 | $2,698 | $78,000 | $8,200 | $69,800 |
| 2020 | $1,331 | $78,000 | $8,200 | $69,800 |
| 2019 | $2,753 | $78,000 | $8,200 | $69,800 |
| 2018 | $2,753 | $78,000 | $8,200 | $69,800 |
| 2017 | $1,855 | $78,000 | $8,200 | $69,800 |
| 2016 | $1,838 | $78,000 | $8,200 | $69,800 |
| 2015 | -- | $78,000 | $8,200 | $69,800 |
| 2014 | -- | $78,000 | $8,200 | $69,800 |
Source: Public Records
Map
Nearby Homes