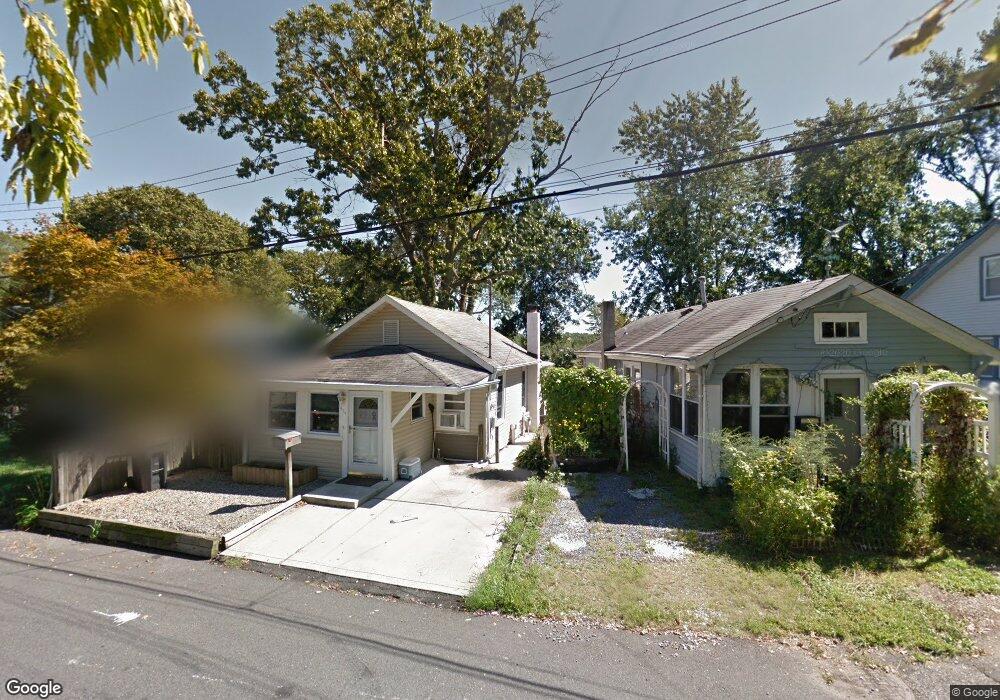
477 Harding Rd South Amboy, NJ 08879
Estimated Value: $254,504 - $360,000
--
Bed
--
Bath
504
Sq Ft
$599/Sq Ft
Est. Value
About This Home
This home is located at 477 Harding Rd, South Amboy, NJ 08879 and is currently estimated at $302,126, approximately $599 per square foot. 477 Harding Rd is a home located in Middlesex County with nearby schools including Old Bridge High School, St. Joseph Elementary School, and Matawan Montessori Academy.
Ownership History
Date
Name
Owned For
Owner Type
Purchase Details
Closed on
Nov 9, 2017
Sold by
Harmony Development Llc
Bought by
Yudin Anton and Pidkameny Walter
Current Estimated Value
Home Financials for this Owner
Home Financials are based on the most recent Mortgage that was taken out on this home.
Original Mortgage
$115,995
Outstanding Balance
$96,940
Interest Rate
3.75%
Mortgage Type
FHA
Estimated Equity
$205,186
Purchase Details
Closed on
Feb 1, 2017
Sold by
Lisak Ann W and Belice Nicholas
Bought by
Harmony Development Llc
Purchase Details
Closed on
Sep 2, 1994
Sold by
Stanley Marko
Bought by
Lisak Ann
Home Financials for this Owner
Home Financials are based on the most recent Mortgage that was taken out on this home.
Original Mortgage
$46,000
Interest Rate
8.38%
Create a Home Valuation Report for This Property
The Home Valuation Report is an in-depth analysis detailing your home's value as well as a comparison with similar homes in the area
Home Values in the Area
Average Home Value in this Area
Purchase History
| Date | Buyer | Sale Price | Title Company |
|---|---|---|---|
| Yudin Anton | $120,000 | First Amer Title Ins Co | |
| Harmony Development Llc | $54,100 | None Available | |
| Lisak Ann | $45,000 | -- |
Source: Public Records
Mortgage History
| Date | Status | Borrower | Loan Amount |
|---|---|---|---|
| Open | Yudin Anton | $115,995 | |
| Previous Owner | Lisak Ann | $46,000 |
Source: Public Records
Tax History Compared to Growth
Tax History
| Year | Tax Paid | Tax Assessment Tax Assessment Total Assessment is a certain percentage of the fair market value that is determined by local assessors to be the total taxable value of land and additions on the property. | Land | Improvement |
|---|---|---|---|---|
| 2025 | $3,632 | $63,400 | $35,400 | $28,000 |
| 2024 | $3,483 | $63,400 | $35,400 | $28,000 |
| 2023 | $3,483 | $63,400 | $35,400 | $28,000 |
| 2022 | $3,389 | $63,400 | $35,400 | $28,000 |
| 2021 | $2,485 | $63,400 | $35,400 | $28,000 |
| 2020 | $3,287 | $63,400 | $35,400 | $28,000 |
| 2019 | $3,234 | $63,400 | $35,400 | $28,000 |
| 2018 | $3,198 | $63,400 | $35,400 | $28,000 |
| 2017 | $3,098 | $63,400 | $35,400 | $28,000 |
| 2016 | $3,037 | $63,400 | $35,400 | $28,000 |
| 2015 | $2,984 | $63,400 | $35,400 | $28,000 |
| 2014 | $2,947 | $63,400 | $35,400 | $28,000 |
Source: Public Records
Map
Nearby Homes
- 235 Garfield Ave
- 250 Brookside Ave
- 146 Orchard Ave
- 301 Shoreland Cir
- 181 Norwood Ave
- 107 Boulevard W
- 238 Shoreland Cir
- 106 Boulevard W
- 169 Norwood Ave
- 438 Brookside Ave
- 615 Greenwood Ave
- 239 Alpine Way
- 21 Lantana Way
- 243 Alpine Way
- 737 Prospect Ave
- 310 Woodland Ave
- 809 Summerfield Ave
- 940 Grove Ave
- 110 Summerfield Ave
- 10 Woodlawn Cir
- 478 Harding Rd
- 476 Harding Rd
- 480 Harding Rd
- 346 Monroe Ave
- 473 Harding Rd
- 481 Harding Rd
- 347 Monroe Ave
- 343 Monroe Ave
- 482 Harding Rd
- 342 Monroe Ave
- 472 Harding Rd
- 348 Monroe Ave
- 378 Madison Ave
- 340 Monroe Ave
- 307 Lincoln Ave
- 377 Madison Ave
- 350 Monroe Ave
- 309 Lincoln Ave
- 305 Lincoln Ave
- 484 Harding Rd