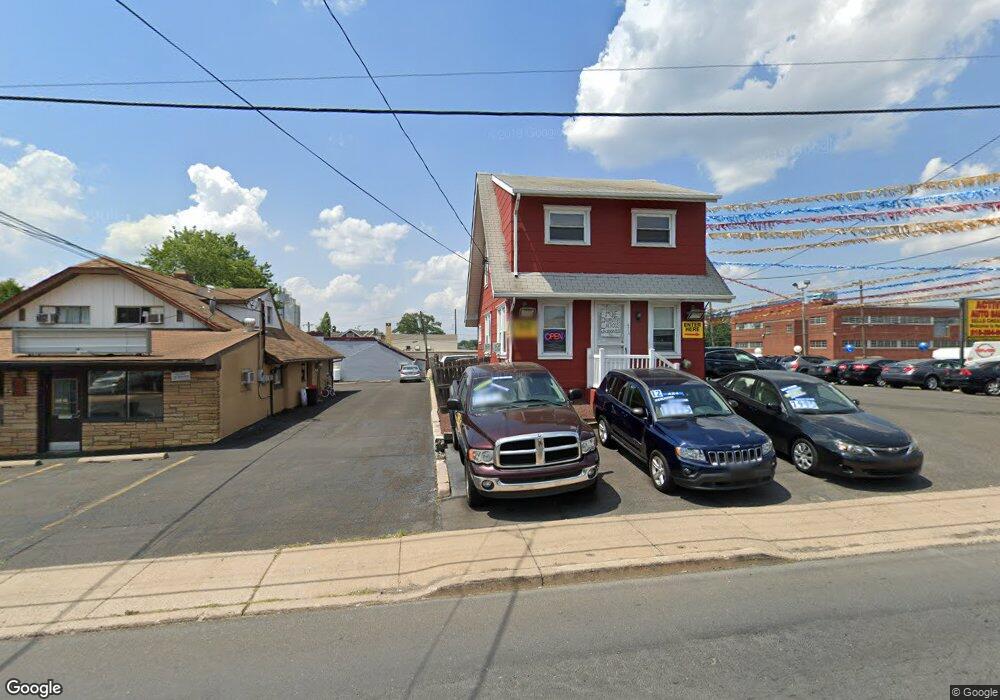
477 Jacksonville Rd Hatboro, PA 19040
Estimated Value: $560,900
Studio
--
Bath
224
Sq Ft
$2,504/Sq Ft
Est. Value
About This Home
This home is located at 477 Jacksonville Rd, Hatboro, PA 19040 and is currently estimated at $560,900, approximately $2,504 per square foot. 477 Jacksonville Rd is a home located in Montgomery County with nearby schools including Keith Valley Middle School, Hatboro-Horsham Senior High School, and Huntingdon Valley Christian Academy.
Ownership History
Date
Name
Owned For
Owner Type
Purchase Details
Closed on
Jun 28, 2018
Sold by
Cohen Amos and Cohen Bonnie E
Bought by
Bolot Ellis and Bolot Aaron
Current Estimated Value
Home Financials for this Owner
Home Financials are based on the most recent Mortgage that was taken out on this home.
Original Mortgage
$260,000
Outstanding Balance
$225,827
Interest Rate
4.6%
Mortgage Type
New Conventional
Estimated Equity
$335,073
Purchase Details
Closed on
Jun 23, 2010
Sold by
Bussinger Edward G and Bussinger Steven E
Bought by
Cohen Amos and Cohen Bonnie E
Home Financials for this Owner
Home Financials are based on the most recent Mortgage that was taken out on this home.
Original Mortgage
$30,000
Interest Rate
4.78%
Mortgage Type
Commercial
Purchase Details
Closed on
Apr 3, 1997
Sold by
Bussinger Edward
Bought by
Bussinger Edward G and Bussinger Edward J
Create a Home Valuation Report for This Property
The Home Valuation Report is an in-depth analysis detailing your home's value as well as a comparison with similar homes in the area
Home Values in the Area
Average Home Value in this Area
Purchase History
| Date | Buyer | Sale Price | Title Company |
|---|---|---|---|
| Bolot Ellis | $360,000 | None Available | |
| Cohen Amos | $340,000 | None Available | |
| Bussinger Edward G | -- | -- |
Source: Public Records
Mortgage History
| Date | Status | Borrower | Loan Amount |
|---|---|---|---|
| Open | Bolot Ellis | $260,000 | |
| Previous Owner | Cohen Amos | $30,000 | |
| Previous Owner | Cohen Amos | $170,000 |
Source: Public Records
Tax History
| Year | Tax Paid | Tax Assessment Tax Assessment Total Assessment is a certain percentage of the fair market value that is determined by local assessors to be the total taxable value of land and additions on the property. | Land | Improvement |
|---|---|---|---|---|
| 2025 | $6,498 | $134,120 | -- | -- |
| 2024 | $6,498 | $134,120 | -- | -- |
| 2023 | $6,184 | $134,120 | $0 | $0 |
| 2022 | $6,023 | $134,120 | $0 | $0 |
| 2021 | $5,879 | $134,120 | $0 | $0 |
| 2020 | $5,707 | $134,120 | $0 | $0 |
| 2019 | $5,618 | $134,120 | $0 | $0 |
Source: Public Records
Map
Nearby Homes
- 465 Jacksonville Rd
- 290 Yards Ct
- 367 Windsor Ave
- 416 Preston Ln
- 550 N York Rd Unit 1-A
- 330 Windsor Ave
- 106 Yorkshire Way
- 10 Home Rd
- 435 Newton Rd
- 437 Newton Rd
- 306 Grape St
- 210 Barbara Ln
- 316 E Moreland Ave
- 427 Tanner Rd
- 513 Stewart Rd
- 119 York Rd
- 213 Green Lane Terrace
- 473 3rd Ave
- 509 Exton Rd
- 237 Byberry Rd
- 473 Jacksonville Rd
- 469 Jacksonville Rd
- 469 Jacksonville Rd Unit C
- 469 Jacksonville Rd Unit B
- 469 Jacksonville Rd Unit A
- 260 E County Line Rd
- 466 Oakdale Ave
- 461 Jacksonville Rd
- 459 Jacksonville Rd
- 335 E County Line Rd
- 457 Jacksonville Rd
- 258 E County Line Rd
- 455 Jacksonville Rd
- 490 Jacksonville Rd
- 456 Oakdale Ave
- 453 Jacksonville Rd
- 482 Jacksonville Rd
- 454 Oakdale Ave
- 451 Jacksonville Rd
- 885 W County Line Rd
Your Personal Tour Guide
Ask me questions while you tour the home.