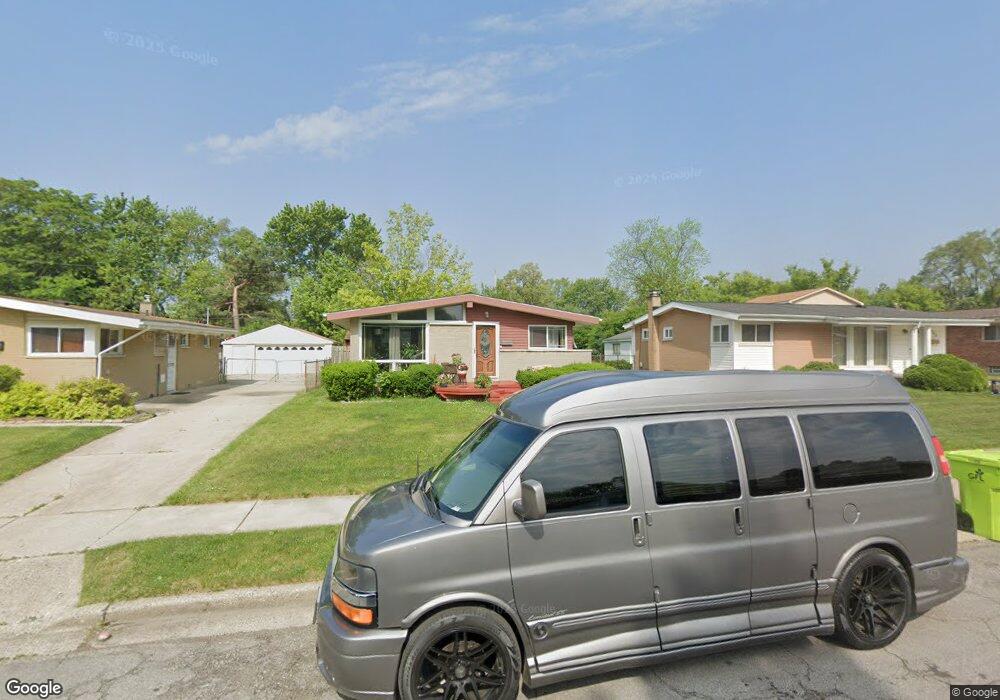
477 Kuhn St Pontiac, MI 48342
Estimated Value: $167,301 - $253,000
3
Beds
1
Bath
966
Sq Ft
$205/Sq Ft
Est. Value
About This Home
This home is located at 477 Kuhn St, Pontiac, MI 48342 and is currently estimated at $197,825, approximately $204 per square foot. 477 Kuhn St is a home located in Oakland County with nearby schools including Herrington Elementary School, Pontiac Middle School, and Pontiac High School.
Ownership History
Date
Name
Owned For
Owner Type
Purchase Details
Closed on
Apr 17, 2009
Sold by
Federal National Mortgage Association
Bought by
Ford Marie and Ford Raymond
Current Estimated Value
Purchase Details
Closed on
Aug 15, 2008
Sold by
Mortgage Electronic Registration Systems
Bought by
Federal National Mortgage Association
Purchase Details
Closed on
Jul 1, 2008
Sold by
Burrell Lynnette R and Burrell Arthur L
Bought by
Mortgage Electronic Registration Systems
Purchase Details
Closed on
Nov 17, 2005
Sold by
Johnson Darrell A and Johnson Phyllis L
Bought by
Burrell Lynnette R and Burrell Arthur L
Purchase Details
Closed on
Sep 12, 1996
Sold by
Johnson Phyllis L
Bought by
Johnson Phyllis L
Home Financials for this Owner
Home Financials are based on the most recent Mortgage that was taken out on this home.
Original Mortgage
$38,850
Interest Rate
8%
Create a Home Valuation Report for This Property
The Home Valuation Report is an in-depth analysis detailing your home's value as well as a comparison with similar homes in the area
Home Values in the Area
Average Home Value in this Area
Purchase History
| Date | Buyer | Sale Price | Title Company |
|---|---|---|---|
| Ford Marie | $20,000 | Warranty Title Agency Llc | |
| Federal National Mortgage Association | -- | None Available | |
| Mortgage Electronic Registration Systems | $141,553 | None Available | |
| Burrell Lynnette R | $134,000 | None Available | |
| Johnson Phyllis L | -- | -- |
Source: Public Records
Mortgage History
| Date | Status | Borrower | Loan Amount |
|---|---|---|---|
| Previous Owner | Johnson Phyllis L | $38,850 |
Source: Public Records
Tax History Compared to Growth
Tax History
| Year | Tax Paid | Tax Assessment Tax Assessment Total Assessment is a certain percentage of the fair market value that is determined by local assessors to be the total taxable value of land and additions on the property. | Land | Improvement |
|---|---|---|---|---|
| 2024 | $1,246 | $54,690 | $0 | $0 |
| 2023 | $1,187 | $48,310 | $0 | $0 |
| 2022 | $1,209 | $43,430 | $0 | $0 |
| 2021 | $1,173 | $38,500 | $0 | $0 |
| 2020 | $1,079 | $34,030 | $0 | $0 |
| 2019 | $1,136 | $28,500 | $0 | $0 |
| 2018 | $1,094 | $23,680 | $0 | $0 |
| 2017 | $1,050 | $22,330 | $0 | $0 |
| 2016 | $1,073 | $20,340 | $0 | $0 |
| 2015 | -- | $19,650 | $0 | $0 |
| 2014 | -- | $18,270 | $0 | $0 |
| 2011 | -- | $25,980 | $0 | $0 |
Source: Public Records
Map
Nearby Homes
- 422 Kuhn St
- 558 Boyd St
- 1277 Liza Blvd
- 590 Jared Dr
- 591 Boyd St
- 413 Thors St
- 1240 University Dr Unit 2
- 1163 Chestnut St Unit 9
- 1861 N Opdyke Rd
- 472 Kenilworth Ave
- 442 Kenilworth Ave
- 457 Cameron Ave
- 428 Jordon Rd
- 880 Bay St
- 770 Cameron Ave
- 715 Kenilworth Ave
- Fairfiled Plan at Fairview Village
- Enclave II Plan at Fairview Village
- Enclave Plan at Fairview Village
- Carlyle Plan at Fairview Village