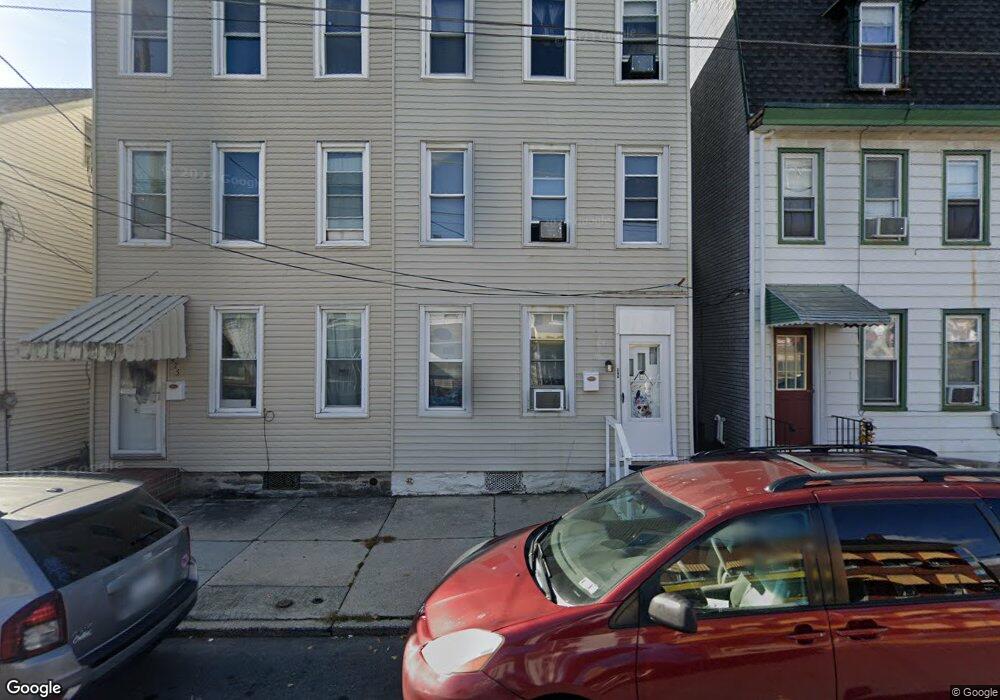
477 N 5th St Lebanon, PA 17046
Estimated Value: $119,000 - $191,000
5
Beds
2
Baths
1,708
Sq Ft
$90/Sq Ft
Est. Value
About This Home
This home is located at 477 N 5th St, Lebanon, PA 17046 and is currently estimated at $153,355, approximately $89 per square foot. 477 N 5th St is a home located in Lebanon County with nearby schools including Houck Elementary School, Harding Elementary School, and Northwest Elementary School.
Ownership History
Date
Name
Owned For
Owner Type
Purchase Details
Closed on
Mar 23, 2015
Sold by
Price Gordon S
Bought by
Versatile Investments Group Llc
Current Estimated Value
Home Financials for this Owner
Home Financials are based on the most recent Mortgage that was taken out on this home.
Original Mortgage
$40,000
Outstanding Balance
$30,545
Interest Rate
3.6%
Mortgage Type
Purchase Money Mortgage
Estimated Equity
$122,810
Purchase Details
Closed on
Sep 11, 2007
Sold by
Deutsche Bank National Trust Company Ame
Bought by
Price Gordon S
Purchase Details
Closed on
Feb 28, 2007
Sold by
Brown Sunshine L
Bought by
Deutsche Bank National Trust Co
Create a Home Valuation Report for This Property
The Home Valuation Report is an in-depth analysis detailing your home's value as well as a comparison with similar homes in the area
Home Values in the Area
Average Home Value in this Area
Purchase History
| Date | Buyer | Sale Price | Title Company |
|---|---|---|---|
| Versatile Investments Group Llc | $48,000 | None Available | |
| Price Gordon S | $41,900 | None Available | |
| Deutsche Bank National Trust Co | $872 | None Available |
Source: Public Records
Mortgage History
| Date | Status | Borrower | Loan Amount |
|---|---|---|---|
| Open | Versatile Investments Group Llc | $40,000 |
Source: Public Records
Tax History Compared to Growth
Tax History
| Year | Tax Paid | Tax Assessment Tax Assessment Total Assessment is a certain percentage of the fair market value that is determined by local assessors to be the total taxable value of land and additions on the property. | Land | Improvement |
|---|---|---|---|---|
| 2025 | $2,120 | $65,800 | $7,400 | $58,400 |
| 2024 | $2,020 | $65,800 | $7,400 | $58,400 |
| 2023 | $2,020 | $65,800 | $7,400 | $58,400 |
| 2022 | $1,987 | $65,800 | $7,400 | $58,400 |
| 2021 | $1,919 | $65,800 | $7,400 | $58,400 |
| 2020 | $1,919 | $65,800 | $7,400 | $58,400 |
| 2019 | $1,891 | $65,800 | $7,400 | $58,400 |
| 2018 | $1,837 | $65,800 | $7,400 | $58,400 |
| 2017 | $518 | $65,800 | $7,400 | $58,400 |
| 2016 | $1,788 | $65,800 | $7,400 | $58,400 |
| 2015 | $1,228 | $65,800 | $7,400 | $58,400 |
| 2014 | $1,228 | $65,800 | $7,400 | $58,400 |
Source: Public Records
Map
Nearby Homes