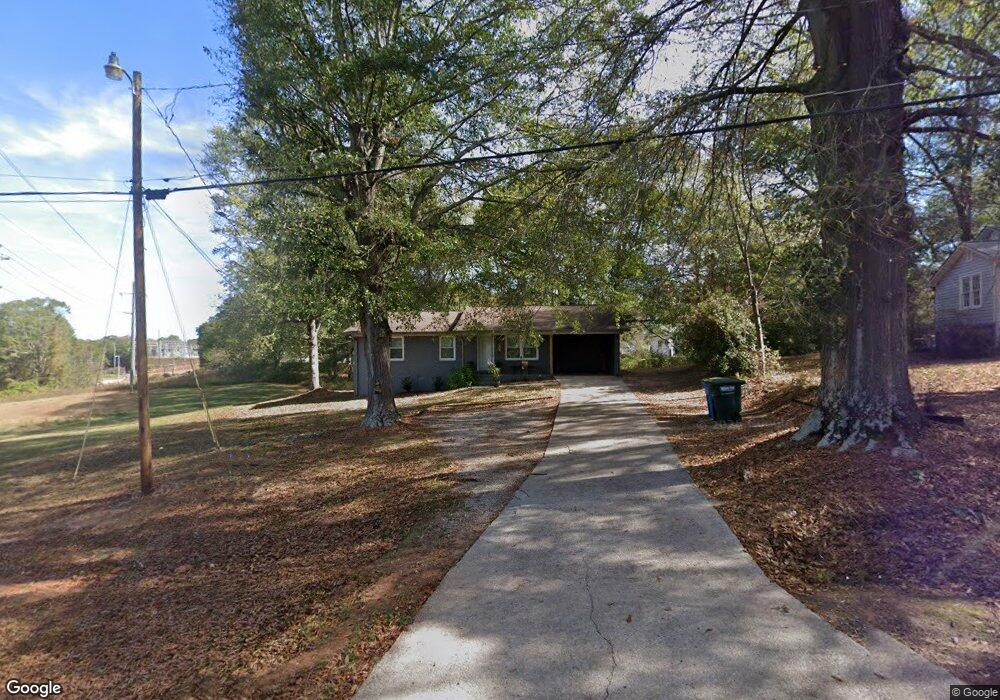
477 Orchard Cir Commerce, GA 30529
Estimated Value: $233,000 - $271,000
2
Beds
2
Baths
1,200
Sq Ft
$209/Sq Ft
Est. Value
About This Home
This home is located at 477 Orchard Cir, Commerce, GA 30529 and is currently estimated at $251,075, approximately $209 per square foot. 477 Orchard Cir is a home located in Jackson County with nearby schools including Commerce Primary School, Commerce Elementary School, and Commerce Middle School.
Ownership History
Date
Name
Owned For
Owner Type
Purchase Details
Closed on
Mar 30, 2022
Sold by
Loggins Marla
Bought by
Smith Tony Dale and Smith Audrey Hayes
Current Estimated Value
Home Financials for this Owner
Home Financials are based on the most recent Mortgage that was taken out on this home.
Original Mortgage
$252,525
Outstanding Balance
$234,151
Interest Rate
3.89%
Mortgage Type
New Conventional
Estimated Equity
$16,924
Purchase Details
Closed on
Jul 6, 2020
Sold by
Faulkner Tammie M
Bought by
Loggins Marla and Loggins Jonathan
Purchase Details
Closed on
Jun 30, 2015
Sold by
Faulkner Timothy Ray
Bought by
Faulkner Tammie M
Purchase Details
Closed on
Mar 1, 2012
Sold by
Faulkner William Ray
Bought by
Faulkner Tammy M
Create a Home Valuation Report for This Property
The Home Valuation Report is an in-depth analysis detailing your home's value as well as a comparison with similar homes in the area
Home Values in the Area
Average Home Value in this Area
Purchase History
| Date | Buyer | Sale Price | Title Company |
|---|---|---|---|
| Smith Tony Dale | $250,000 | -- | |
| Loggins Marla | $114,000 | -- | |
| Faulkner Tammie M | -- | -- | |
| Faulkner Tammy M | -- | -- | |
| Faulkner Tammy M | -- | -- |
Source: Public Records
Mortgage History
| Date | Status | Borrower | Loan Amount |
|---|---|---|---|
| Open | Smith Tony Dale | $252,525 |
Source: Public Records
Tax History
| Year | Tax Paid | Tax Assessment Tax Assessment Total Assessment is a certain percentage of the fair market value that is determined by local assessors to be the total taxable value of land and additions on the property. | Land | Improvement |
|---|---|---|---|---|
| 2025 | $2,426 | $95,336 | $39,440 | $55,896 |
| 2024 | $2,426 | $79,536 | $23,640 | $55,896 |
| 2023 | $2,178 | $72,896 | $23,640 | $49,256 |
| 2022 | $1,543 | $47,576 | $17,720 | $29,856 |
| 2021 | $1,476 | $47,576 | $17,720 | $29,856 |
| 2020 | $1,508 | $41,616 | $17,720 | $23,896 |
| 2019 | $1,530 | $41,616 | $17,720 | $23,896 |
| 2018 | $1,579 | $43,320 | $17,720 | $25,600 |
| 2017 | $1,513 | $40,787 | $17,756 | $23,031 |
| 2016 | $1,381 | $37,044 | $14,013 | $23,031 |
| 2015 | $1,364 | $35,768 | $12,737 | $23,031 |
| 2014 | $1,171 | $30,461 | $12,737 | $17,724 |
| 2013 | -- | $31,400 | $12,736 | $18,663 |
Source: Public Records
Map
Nearby Homes
- 191 Orchard Cir
- 245 Hospital Rd
- 44 Troy St
- 321 Pine Ave
- 0 Ridgeway St
- 2140 N Broad St
- 83 Ridgeway Dr
- 286 Pine Ave
- 51 Pine Ave
- 304 Hill St
- 25 Beckett Way
- 92 Duncan St Unit LOT 1 AND 2
- 3142 Maysville Rd
- 3162 Maysville Rd
- 177 Bolton Dr
- 178 Cole Court Dr
- 8569 Jefferson Rd
- 31 Coles Court Dr
- 0 Martin Luther King Junior Dr Unit CL336436
- 0 Martin Luther King Junior Dr
- 489 Orchard Cir
- 165 Brookwood Ave
- 103 Brookwood Ave
- 184 Orchard Dr
- 154 Orchard Cir
- 154 Orchard Dr
- 2530 N Broad St
- 170 Orchard Dr
- 196 Orchard Dr
- 2496 N Broad St
- 183 Brookwood Ave
- 2512 N Broad St
- 122 Orchard Dr
- 69 Brookwood Ave
- 142 Brookwood Ave
- 202 Orchard Dr
- 2574 N Broad St
- 122 Brookwood Ave
- 96 Brookwood Ave
- 96 Orchard Dr Unit O
Your Personal Tour Guide
Ask me questions while you tour the home.