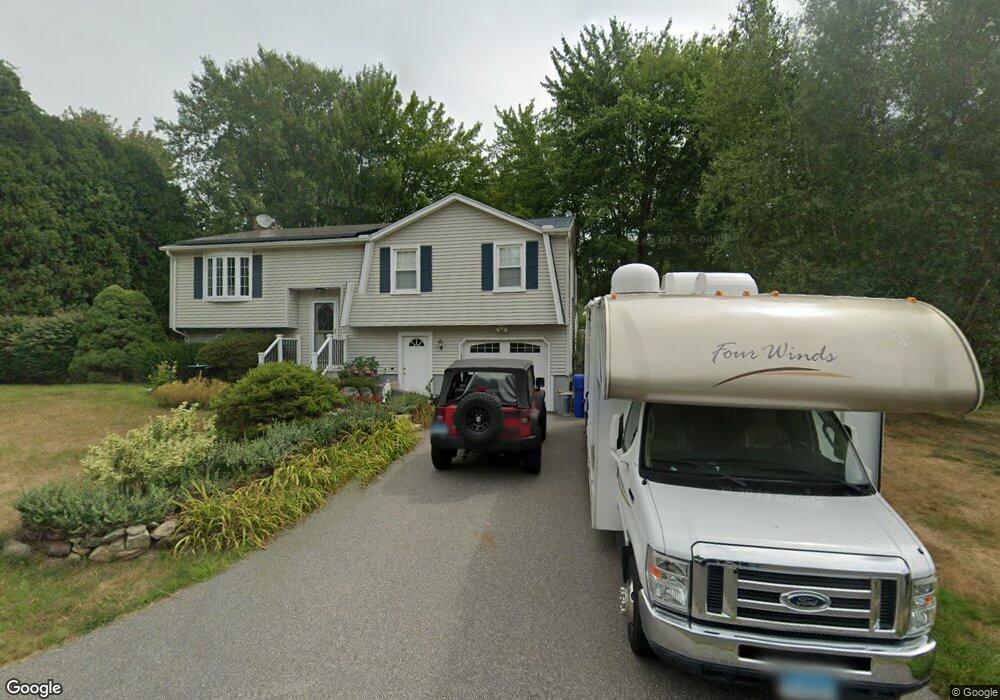
477 Oxbow Dr Torrington, CT 06790
Estimated Value: $318,000 - $390,000
4
Beds
2
Baths
1,080
Sq Ft
$316/Sq Ft
Est. Value
About This Home
This home is located at 477 Oxbow Dr, Torrington, CT 06790 and is currently estimated at $341,014, approximately $315 per square foot. 477 Oxbow Dr is a home located in Litchfield County with nearby schools including Torrington Middle School, Torrington High School, and Torrington Christian Academy.
Ownership History
Date
Name
Owned For
Owner Type
Purchase Details
Closed on
Jul 26, 2021
Sold by
Mckenna Shirley L
Bought by
Mckenna Peter J and Mckenna Shirley L
Current Estimated Value
Home Financials for this Owner
Home Financials are based on the most recent Mortgage that was taken out on this home.
Original Mortgage
$132,000
Outstanding Balance
$100,336
Interest Rate
2.24%
Mortgage Type
Stand Alone Refi Refinance Of Original Loan
Estimated Equity
$240,678
Purchase Details
Closed on
Apr 30, 1993
Sold by
Sluis Bennett A
Bought by
Mckenna Peter J
Purchase Details
Closed on
Oct 14, 1988
Sold by
Simerly Dennis B
Bought by
Sluis Bennett A
Purchase Details
Closed on
Jun 9, 1987
Sold by
Westrom Gerald A
Bought by
Semerly Dennis B
Create a Home Valuation Report for This Property
The Home Valuation Report is an in-depth analysis detailing your home's value as well as a comparison with similar homes in the area
Home Values in the Area
Average Home Value in this Area
Purchase History
| Date | Buyer | Sale Price | Title Company |
|---|---|---|---|
| Mckenna Peter J | -- | None Available | |
| Mckenna Peter J | -- | None Available | |
| Mckenna Peter J | $118,000 | -- | |
| Mckenna Peter J | $118,000 | -- | |
| Sluis Bennett A | $138,000 | -- | |
| Semerly Dennis B | $144,000 | -- |
Source: Public Records
Mortgage History
| Date | Status | Borrower | Loan Amount |
|---|---|---|---|
| Open | Mckenna Peter J | $132,000 | |
| Previous Owner | Semerly Dennis B | $135,000 | |
| Previous Owner | Semerly Dennis B | $55,000 |
Source: Public Records
Tax History
| Year | Tax Paid | Tax Assessment Tax Assessment Total Assessment is a certain percentage of the fair market value that is determined by local assessors to be the total taxable value of land and additions on the property. | Land | Improvement |
|---|---|---|---|---|
| 2025 | $7,167 | $186,410 | $30,520 | $155,890 |
| 2024 | $5,140 | $107,140 | $30,550 | $76,590 |
| 2023 | $5,138 | $107,140 | $30,550 | $76,590 |
| 2022 | $5,051 | $107,140 | $30,550 | $76,590 |
| 2021 | $4,947 | $107,140 | $30,550 | $76,590 |
| 2020 | $4,947 | $107,140 | $30,550 | $76,590 |
| 2019 | $4,336 | $93,910 | $33,940 | $59,970 |
| 2018 | $4,336 | $93,910 | $33,940 | $59,970 |
| 2017 | $4,296 | $93,910 | $33,940 | $59,970 |
| 2016 | $4,296 | $93,910 | $33,940 | $59,970 |
| 2015 | $4,296 | $93,910 | $33,940 | $59,970 |
| 2014 | $4,904 | $135,030 | $56,980 | $78,050 |
Source: Public Records
Map
Nearby Homes
- 111 Oxbow Dr
- 65 Oak Meadow Ln Unit 65
- 660 Torringford St
- 175 Ramstein Rd
- 163 Rock Creek Ln
- 179 Greenridge Rd
- 0 Torringford St W
- 272 Edgewood Dr
- 32 Ridgewood Dr
- 323 Highfield Dr
- 146 Highfield Dr
- 76 Elmira Ave
- 14 Hannah Way
- 23 Hannah Way
- 101 Durand St
- 151 Highview Dr
- 195 Torrington Heights Rd
- 98 Wheeler Ln
- 164 Birge Park Rd
- 238 Barton St
- 491 Oxbow Dr
- 465 Oxbow Dr
- 503 Oxbow Dr
- 451 Oxbow Dr
- 480 Oxbow Dr
- 247 Torringford East St
- 233 Torringford East St
- 468 Oxbow Dr
- 494 Oxbow Dr
- 259 Torringford East St
- 221 Torringford East St
- 448 Oxbow Dr
- 273 Torringford East St
- 517 Oxbow Dr
- 439 Oxbow Dr
- 506 Oxbow Dr
- 205 Torringford East St
- 287 Torringford East St
- 520 Oxbow Dr
- 434 Oxbow Dr
Your Personal Tour Guide
Ask me questions while you tour the home.