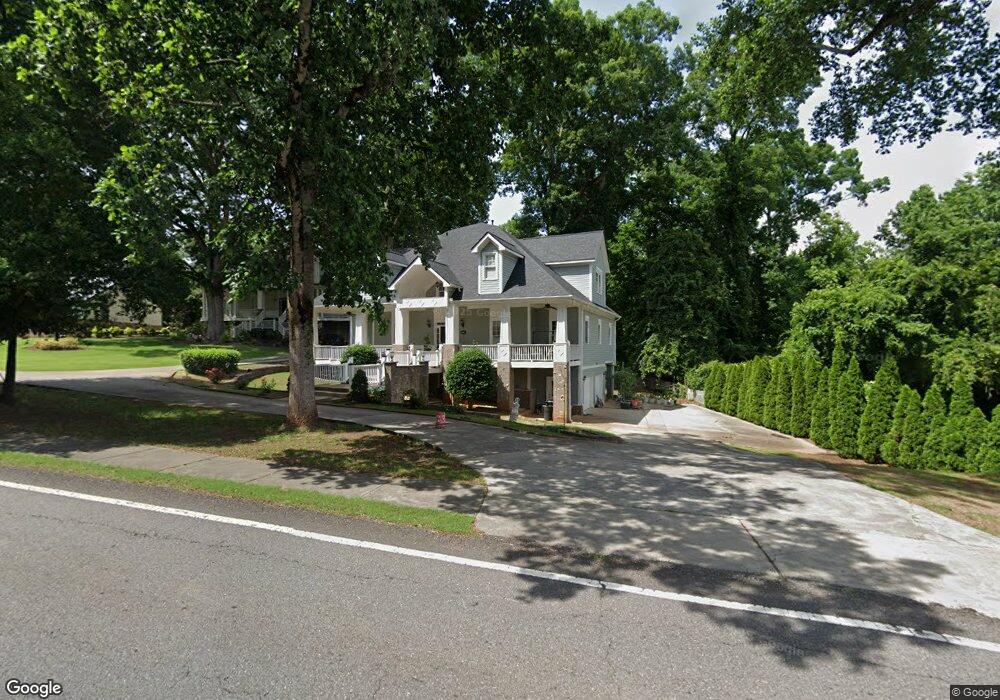
477 Pine Grove Rd Roswell, GA 30075
Estimated Value: $726,000 - $995,000
3
Beds
4
Baths
3,307
Sq Ft
$268/Sq Ft
Est. Value
About This Home
This home is located at 477 Pine Grove Rd, Roswell, GA 30075 and is currently estimated at $885,712, approximately $267 per square foot. 477 Pine Grove Rd is a home located in Fulton County with nearby schools including Roswell North Elementary School, Crabapple Middle School, and Roswell High School.
Ownership History
Date
Name
Owned For
Owner Type
Purchase Details
Closed on
Jul 9, 2008
Sold by
Deutsche Bk Natl 2005 & 4
Bought by
Patel Arvind C and Patel Smita A
Current Estimated Value
Home Financials for this Owner
Home Financials are based on the most recent Mortgage that was taken out on this home.
Original Mortgage
$312,300
Interest Rate
6.27%
Mortgage Type
New Conventional
Purchase Details
Closed on
Mar 4, 2008
Sold by
Lewis Brian W
Bought by
Deutsche Bk Natl Trust C 2005 &
Purchase Details
Closed on
Aug 27, 2003
Sold by
Borkowski Carolyn
Bought by
Custom Concepts Design & Renov
Home Financials for this Owner
Home Financials are based on the most recent Mortgage that was taken out on this home.
Original Mortgage
$350,000
Interest Rate
6.33%
Create a Home Valuation Report for This Property
The Home Valuation Report is an in-depth analysis detailing your home's value as well as a comparison with similar homes in the area
Home Values in the Area
Average Home Value in this Area
Purchase History
| Date | Buyer | Sale Price | Title Company |
|---|---|---|---|
| Patel Arvind C | $347,000 | -- | |
| Deutsche Bk Natl Trust C 2005 & | $321,200 | -- | |
| Custom Concepts Design & Renov | $125,000 | -- |
Source: Public Records
Mortgage History
| Date | Status | Borrower | Loan Amount |
|---|---|---|---|
| Closed | Patel Arvind C | $312,300 | |
| Previous Owner | Custom Concepts Design & Renov | $350,000 |
Source: Public Records
Tax History Compared to Growth
Tax History
| Year | Tax Paid | Tax Assessment Tax Assessment Total Assessment is a certain percentage of the fair market value that is determined by local assessors to be the total taxable value of land and additions on the property. | Land | Improvement |
|---|---|---|---|---|
| 2025 | $942 | $301,440 | $100,720 | $200,720 |
| 2023 | $6,022 | $213,360 | $39,920 | $173,440 |
| 2022 | $4,311 | $213,360 | $39,920 | $173,440 |
| 2021 | $5,395 | $207,120 | $38,760 | $168,360 |
| 2020 | $5,588 | $204,640 | $38,280 | $166,360 |
| 2019 | $835 | $201,040 | $37,600 | $163,440 |
| 2018 | $4,175 | $196,320 | $36,720 | $159,600 |
| 2017 | $4,320 | $160,000 | $35,080 | $124,920 |
| 2016 | $4,319 | $160,000 | $35,080 | $124,920 |
| 2015 | $5,209 | $160,000 | $35,080 | $124,920 |
| 2014 | $4,529 | $188,800 | $35,320 | $153,480 |
Source: Public Records
Map
Nearby Homes
- 555 Ramsdale Dr
- 1130 Lake Dr
- 495 Ramsdale Dr
- 610 Pine Grove Rd
- 965 Lake Charles Dr
- 8040 Magnolia Way
- 525 Wickerberry Ln
- 5060 Magnolia Walk
- 1070 Stonegrove Ln
- 180 Thompson Place
- 1024 Lake Charles Dr
- 300 Farm Track Unit 3
- 325 Farm Trace
- 340 Farm Path Unit 2
- 145 Grayton Ln
- 130 Farm Hill Cir
- 9760 Loblolly Ln
- 385 Roswell Farms Rd Unit 2
- 479 Pine Grove Rd
- 470 Pine Grove Rd
- 481 Pine Grove Rd
- 100 Lynwood Dr
- 110 Lynwood Dr
- 540 Pine Grove Rd
- 5025 Old Oak Trace
- 1040 Carmichle Ct
- 1040 Carmichle Ct Unit 7
- 5010 Old Oak Trace
- 550 Pine Grove Rd
- 5035 Old Oak Trace
- 1045 Carmichle Ct
- 525 Pine Grove Rd
- 5000 Old Oak Trace
- 120 Lynwood Dr
- 554 Pine Grove Rd
- 1030 Carmichle Ct
- 0 Lynwood Dr Unit 7513504
- 0 Lynwood Dr Unit 7224197