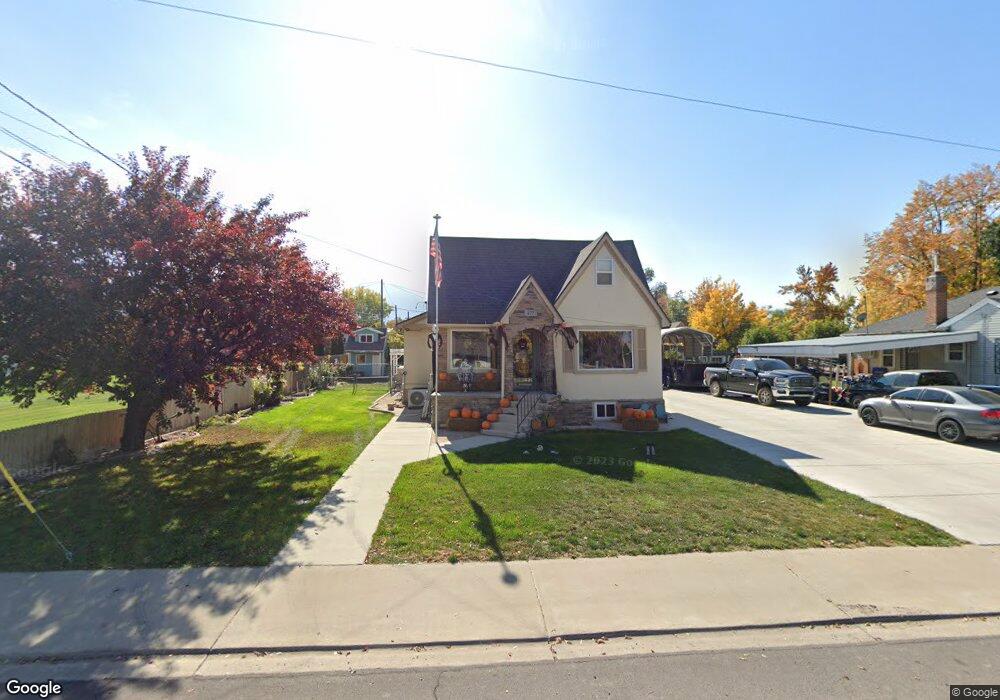
477 W 300 N Payson, UT 84651
Estimated Value: $407,000 - $436,000
3
Beds
3
Baths
1,004
Sq Ft
$417/Sq Ft
Est. Value
About This Home
This home is located at 477 W 300 N, Payson, UT 84651 and is currently estimated at $419,076, approximately $417 per square foot. 477 W 300 N is a home located in Utah County with nearby schools including Taylor Elementary School, Salem Junior High School, and Valley View Middle School.
Ownership History
Date
Name
Owned For
Owner Type
Purchase Details
Closed on
Apr 19, 2016
Sold by
Montague Brad C and Montague Jenny
Bought by
Montague Brad C and Montague Jennifer P
Current Estimated Value
Home Financials for this Owner
Home Financials are based on the most recent Mortgage that was taken out on this home.
Original Mortgage
$144,000
Outstanding Balance
$63,034
Interest Rate
3.68%
Mortgage Type
New Conventional
Estimated Equity
$356,042
Purchase Details
Closed on
Dec 20, 2006
Sold by
Patten Janice L
Bought by
Patten Janice L
Purchase Details
Closed on
Apr 28, 1999
Sold by
Patten Duane H and Patten Janice L
Bought by
Montague Brad C and Montague Jenny
Home Financials for this Owner
Home Financials are based on the most recent Mortgage that was taken out on this home.
Original Mortgage
$96,000
Interest Rate
6.98%
Create a Home Valuation Report for This Property
The Home Valuation Report is an in-depth analysis detailing your home's value as well as a comparison with similar homes in the area
Home Values in the Area
Average Home Value in this Area
Purchase History
| Date | Buyer | Sale Price | Title Company |
|---|---|---|---|
| Montague Brad C | -- | Utah First Title Insurance | |
| Patten Janice L | -- | None Available | |
| Montague Brad C | -- | Wasatch Land & Title |
Source: Public Records
Mortgage History
| Date | Status | Borrower | Loan Amount |
|---|---|---|---|
| Open | Montague Brad C | $144,000 | |
| Closed | Montague Brad C | $96,000 |
Source: Public Records
Tax History
| Year | Tax Paid | Tax Assessment Tax Assessment Total Assessment is a certain percentage of the fair market value that is determined by local assessors to be the total taxable value of land and additions on the property. | Land | Improvement |
|---|---|---|---|---|
| 2025 | $1,928 | $217,305 | -- | -- |
| 2024 | $1,928 | $196,185 | $0 | $0 |
| 2023 | $1,881 | $191,950 | $0 | $0 |
| 2022 | $1,766 | $177,210 | $0 | $0 |
| 2021 | $1,501 | $241,600 | $80,700 | $160,900 |
| 2020 | $1,394 | $219,500 | $70,200 | $149,300 |
| 2019 | $1,316 | $212,500 | $63,200 | $149,300 |
| 2018 | $1,209 | $188,200 | $53,300 | $134,900 |
| 2017 | $1,103 | $92,290 | $0 | $0 |
| 2016 | $976 | $81,180 | $0 | $0 |
| 2015 | $960 | $79,255 | $0 | $0 |
| 2014 | $842 | $70,015 | $0 | $0 |
Source: Public Records
Map
Nearby Homes
- 451 N 500 W
- 451 N 500 W Unit 39
- 195 W 300 N
- 588 W Utah Ave
- 420 N 150 W
- 845 W 400 N
- 116 S 300 W
- 128 S 300 W
- 383 W 625 N Unit A-D
- 384 W 650 N Unit A-D
- 361 W 625 N Unit A-D
- 118 E 100 N
- 9672 S 3550 W
- 390 N 200 E
- 116 E 100 S
- 1287 N 1390 E Unit 25-96
- 221 S Majestic Meadows Dr
- 227 S Majestic Meadows Dr
- 433 E 450 N
- 742 W 400 S
Your Personal Tour Guide
Ask me questions while you tour the home.