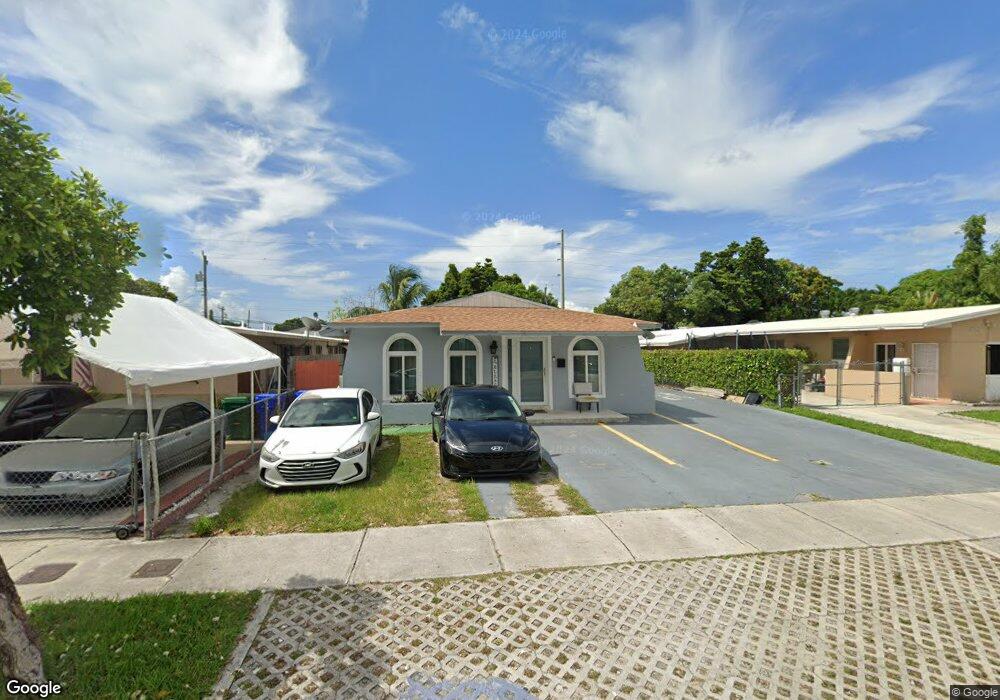
4770 NW 4th Terrace Miami, FL 33126
Flagami NeighborhoodEstimated Value: $618,000 - $919,000
5
Beds
3
Baths
2,353
Sq Ft
$321/Sq Ft
Est. Value
About This Home
This home is located at 4770 NW 4th Terrace, Miami, FL 33126 and is currently estimated at $754,338, approximately $320 per square foot. 4770 NW 4th Terrace is a home located in Miami-Dade County with nearby schools including Henry M. Flagler Elementary School, Kinloch Park Middle School, and Coral Gables Senior High School.
Ownership History
Date
Name
Owned For
Owner Type
Purchase Details
Closed on
Oct 17, 2006
Sold by
Jo Evaristo
Bought by
Leng Angela
Current Estimated Value
Home Financials for this Owner
Home Financials are based on the most recent Mortgage that was taken out on this home.
Original Mortgage
$305,280
Outstanding Balance
$193,366
Interest Rate
7.6%
Mortgage Type
Balloon
Estimated Equity
$560,972
Purchase Details
Closed on
Oct 6, 2006
Sold by
Leng Angela
Bought by
Reynaud Ruth Arely
Home Financials for this Owner
Home Financials are based on the most recent Mortgage that was taken out on this home.
Original Mortgage
$305,280
Outstanding Balance
$193,366
Interest Rate
7.6%
Mortgage Type
Balloon
Estimated Equity
$560,972
Purchase Details
Closed on
Sep 22, 1997
Sold by
Jo Evaristo and Hung Ka Wah
Bought by
Leng Angela
Purchase Details
Closed on
Jun 19, 1997
Sold by
Jo Evaristo
Bought by
Jo Evaristo and Jo Edwin
Create a Home Valuation Report for This Property
The Home Valuation Report is an in-depth analysis detailing your home's value as well as a comparison with similar homes in the area
Home Values in the Area
Average Home Value in this Area
Purchase History
| Date | Buyer | Sale Price | Title Company |
|---|---|---|---|
| Leng Angela | -- | Trustar Title Insurance Co | |
| Reynaud Ruth Arely | $381,600 | Trustar Title Ins Co | |
| Leng Angela | -- | Trustar Title Insurance Co | |
| Leng Angela | $100 | -- | |
| Jo Evaristo | $100 | -- |
Source: Public Records
Mortgage History
| Date | Status | Borrower | Loan Amount |
|---|---|---|---|
| Open | Reynaud Ruth Arely | $305,280 |
Source: Public Records
Tax History Compared to Growth
Tax History
| Year | Tax Paid | Tax Assessment Tax Assessment Total Assessment is a certain percentage of the fair market value that is determined by local assessors to be the total taxable value of land and additions on the property. | Land | Improvement |
|---|---|---|---|---|
| 2025 | $12,816 | $365,101 | -- | -- |
| 2024 | $12,328 | $339,681 | -- | -- |
| 2023 | $12,328 | $316,240 | $0 | $0 |
| 2022 | $11,838 | $294,713 | $0 | $0 |
| 2021 | $9,260 | $274,933 | $0 | $0 |
| 2020 | $5,711 | $274,087 | $0 | $0 |
| 2019 | $5,386 | $258,347 | $0 | $0 |
| 2018 | $5,166 | $252,333 | $0 | $0 |
| 2017 | $4,987 | $239,999 | $0 | $0 |
| 2016 | $4,817 | $225,363 | $0 | $0 |
| 2015 | $4,665 | $213,271 | $0 | $0 |
| 2014 | $4,409 | $202,122 | $0 | $0 |
Source: Public Records
Map
Nearby Homes
- 4518 NW 4th St
- 4789 NW 1st St
- 4519 NW 3rd St
- 241 NW 46th Ave
- 97 NW 47th Ct
- 47 NW 47th Ave Unit 10
- 420 NW 44th Ave
- 4841 NW 7th St Unit 2034
- 4855 NW 7th St Unit 2086
- 4709 NW 7th St Unit 2049
- 4709 NW 7th St Unit 1059
- 4709 NW 7th St Unit 4059
- 4831 W Flagler St
- 4717 NW 7th St Unit 30410
- 4717 NW 7th St Unit 60410
- 4550 NW 9th St Unit 520E
- 4550 NW 9th St Unit 106E
- 5031 NW 4th St
- 4801 NW 7th St Unit 80316
- 4801 NW 7th St Unit 81016
- 4760 NW 4th Terrace
- 4780 NW 4th Terrace
- 4750 NW 4th Terrace
- 4790 NW 4th Terrace
- 4771 NW 4th St
- 4740 NW 4th Terrace
- 4781 NW 4th St
- 4800 NW 4th Terrace
- 4751 NW 4th St
- 4797 NW 4th St
- 4791 NW 4th Terrace
- 4791 NW 4th Terrace Unit B
- 4791 NW 4th Terrace Unit A
- 4791 NW 4th Terrace Unit 1
- 4730 NW 4th Terrace
- 4781 NW 4th Terrace
- 4771 NW 4th Terrace
- 4745 NW 4th St
- 4803 NW 4th Terrace
- 4761 NW 4th Terrace