NOT LISTED FOR SALE

4770 Pepelani Loop Unit 125 Princeville, HI 96722

Estimated Value: $814,000 - $1,021,000

2 Beds
2 Baths
1,042 Sq Ft
$894/Sq Ft Est. Value

Last Sold October 26, 2012

Last sale price $225,000 $216 Per Sq Ft

Est. 314% increase in value since last sale

Current estimated payment $5,855/month

About This Home

As of October 2012

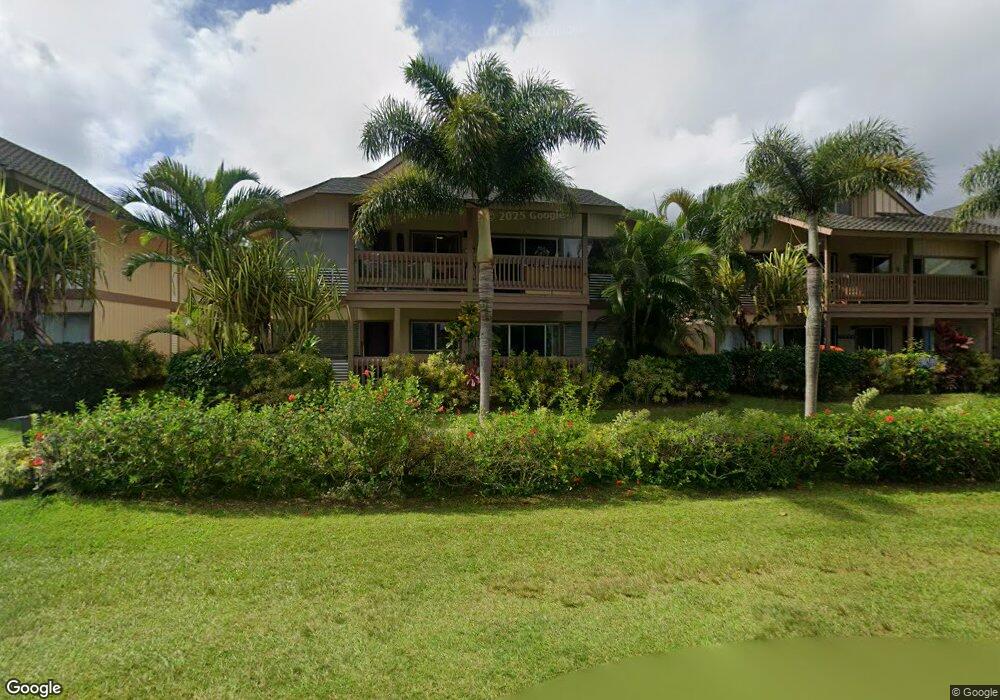
Beautifully upgraded. Bright and airy. Nicely furnished.

Ownership History

Date Name Owned For Owner Type

Purchase Details

Closed on
May 17, 2007
Sold by
Yuen Elarka S H
Bought by
Vincent Toni
Current Estimated Value
$931,233

Home Financials for this Owner

Home Financials are based on the most recent Mortgage that was taken out on this home.
Original Mortgage
$100,000
Outstanding Balance
$60,860
Interest Rate
6.18%
Mortgage Type
New Conventional
Estimated Equity
$870,373

Purchase Details

Closed on
Apr 26, 2005
Sold by
Thayer Mary C
Bought by
Yuen Elarka S H and Elarka S H Yuen Revocable Trust

Home Financials for this Owner

Home Financials are based on the most recent Mortgage that was taken out on this home.
Original Mortgage
$332,000
Interest Rate
5.99%
Mortgage Type
Fannie Mae Freddie Mac

Purchase Details

Closed on
Nov 17, 1998
Sold by
Rose Karvel C and Rose Nancy S
Bought by
Thayer Mary C and Trust Of Mary C Thayer
Source: Public Records

Range of Values:

Collateral Analytics

Collateral Analytics Collateral Analytics AVMs (Automated Valuation Model) employ a number of statistical approaches combined with neighborhood-specific comparable selection guarantees the most up-to-date and precise valuations.

Not Available

Collateral Analytics does not have data for the current month. Please view the chart for historical values.

ICE

ICE Mortgage Technology ICE Mortgage Technology’s AVM (Automated Valuation Model) is a state-of-the-art online residential property valuation tool that provides a quick and accurate estimate of the value of almost any home in the U.S.

Not Available

ICE Mortgage Technology does not have data for the current month. Please view the chart for historical values.

First American

First American First American Data & Analytics’ next-generation AVM combines unrivaled data assets with a blended ensemble of valuation models to produce highly accurate, reliable valuations you can trust.

Not Available

First American does not have data for the current month. Please view the chart for historical values.

Quantarium

Quantarium Quantarium’s valuation service, repeatedly proven the industry’s most accurate and comprehensive, is supercharged with a self-learning and auto-tuning AI engine that continually becomes smarter and more accurate as it processes daily inputs from the industry’s leading RE data lake.

Not Available

Quantarium does not have data for the current month. Please view the chart for historical values.

Average Value
Not Available
List Price
Sold Price
Create a Home Valuation Report for This Property
The Home Valuation Report is an in-depth analysis detailing your home's value as well as a comparison with similar homes in the area

Home Values in the Area

Source: Public Records

Average Home Value in this Area


Source: Public Records

Purchase History

Date Buyer Sale Price Title Company
Vincent Toni $499,000 Tg
Yuen Elarka S H $415,000 Tg
Thayer Mary C $77,500 --
Source: Public Records

Mortgage History

Date Status Borrower Loan Amount
Open Vincent Toni $100,000
Previous Owner Yuen Elarka S H $332,000
Closed Yuen Elarka S H $62,250
Source: Public Records

Property History

Date Event Price List to Sale Price per Sq Ft Prior Sale
10/26/2012 10/26/12 Sold $225,000 -5.9% $216 / Sq Ft View Prior Sale
07/24/2012 07/24/12 Pending -- -- --
07/24/2012 07/24/12 For Sale $239,000 -- $229 / Sq Ft

Tax History Compared to Growth

Source: Public Records

Tax History

Year Tax Paid Tax Assessment Tax Assessment Total Assessment is a certain percentage of the fair market value that is determined by local assessors to be the total taxable value of land and additions on the property. Land Improvement
2025 $4,037 $895,200 -- $895,200
2024 $4,037 $740,800 -- $740,800
2023 $4,007 $735,300 $0 $735,300
2022 $3,181 $525,800 $0 $0
2021 $2,824 $466,800 $0 $0
2020 $2,612 $431,700 $0 $431,700
2019 $2,371 $391,900 $0 $391,900
2018 $2,185 $361,200 $0 $361,200
2017 $2,116 $349,700 $0 $349,700
2016 $2,081 $343,900 $0 $343,900
2015 $1,235 $279,000 $0 $0
2014 $1,691 $244,400 $0 $0
Source: Public Records

Agents Affiliated with this Home

  • Section Image
  • Section Image
See All Agents

Map