Estimated Value: $395,000 - $417,000
3
Beds
2
Baths
1,049
Sq Ft
$382/Sq Ft
Est. Value
About This Home
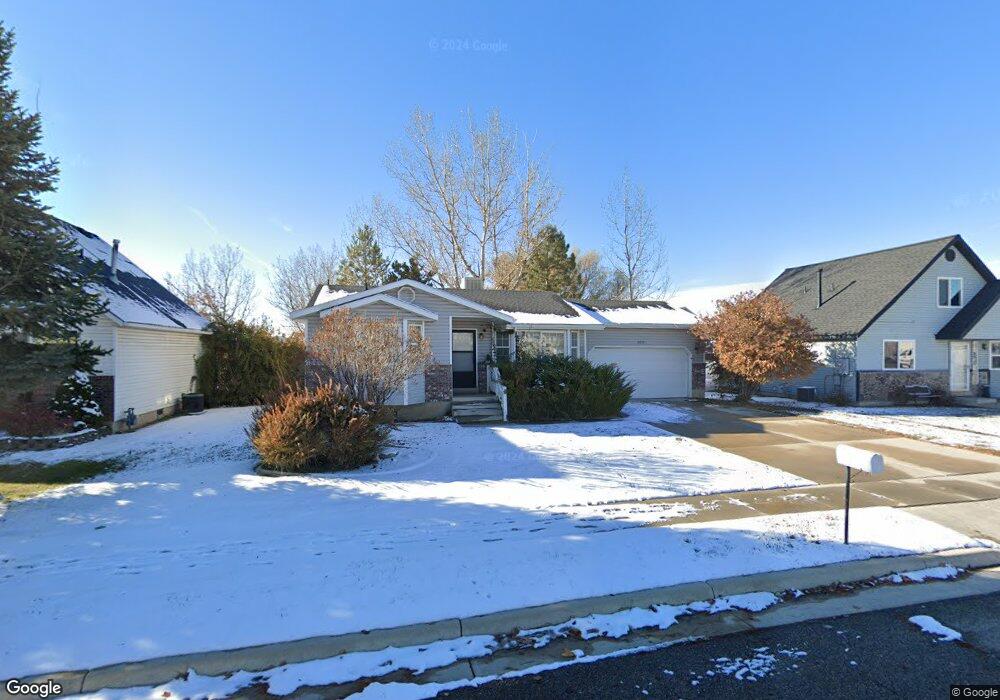
This home is located at 4771 S 3900 W, Roy, UT 84067 and is currently estimated at $400,689, approximately $381 per square foot. 4771 S 3900 W is a home located in Weber County with nearby schools including West Haven School, Sand Ridge Junior High School, and Roy High School.
Ownership History
Date
Name
Owned For
Owner Type
Purchase Details
Closed on
Mar 10, 2005
Sold by
Talbert Janet K
Bought by
Jeppesen Rebecca R
Current Estimated Value
Home Financials for this Owner
Home Financials are based on the most recent Mortgage that was taken out on this home.
Original Mortgage
$112,410
Outstanding Balance
$60,866
Interest Rate
6.65%
Mortgage Type
Fannie Mae Freddie Mac
Estimated Equity
$339,823
Purchase Details
Closed on
Oct 12, 2001
Sold by
Odell Larry
Bought by
Talbert Kenneth H
Purchase Details
Closed on
Nov 20, 1997
Sold by
R & B Tolman Lc
Bought by
Perez Fidel D
Home Financials for this Owner
Home Financials are based on the most recent Mortgage that was taken out on this home.
Original Mortgage
$35,000
Interest Rate
7.23%
Mortgage Type
Purchase Money Mortgage
Purchase Details
Closed on
Apr 10, 1997
Sold by
Tiffany Development Lc
Bought by
R & B Tolman Lc
Create a Home Valuation Report for This Property
The Home Valuation Report is an in-depth analysis detailing your home's value as well as a comparison with similar homes in the area
Home Values in the Area
Average Home Value in this Area
Purchase History
| Date | Buyer | Sale Price | Title Company |
|---|---|---|---|
| Jeppesen Rebecca R | -- | First American Title | |
| Talbert Kenneth H | -- | Associated Title | |
| The Jk Talbert Family Trust | -- | Founders Title Co | |
| Perez Fidel D | -- | Bonneville Title | |
| R & B Tolman Lc | -- | Bonneville Title |
Source: Public Records
Mortgage History
| Date | Status | Borrower | Loan Amount |
|---|---|---|---|
| Open | Jeppesen Rebecca R | $112,410 | |
| Previous Owner | Perez Fidel D | $35,000 |
Source: Public Records
Tax History Compared to Growth
Tax History
| Year | Tax Paid | Tax Assessment Tax Assessment Total Assessment is a certain percentage of the fair market value that is determined by local assessors to be the total taxable value of land and additions on the property. | Land | Improvement |
|---|---|---|---|---|
| 2025 | $2,432 | $382,197 | $128,127 | $254,070 |
| 2024 | $2,375 | $206,799 | $70,469 | $136,330 |
| 2023 | $2,211 | $191,950 | $67,964 | $123,986 |
| 2022 | $2,263 | $202,950 | $60,038 | $142,912 |
| 2021 | $1,907 | $281,000 | $79,109 | $201,891 |
| 2020 | $1,927 | $263,000 | $79,109 | $183,891 |
| 2019 | $1,799 | $230,000 | $49,211 | $180,789 |
| 2018 | $1,707 | $205,000 | $41,372 | $163,628 |
| 2017 | $1,549 | $173,000 | $41,372 | $131,628 |
| 2016 | $1,551 | $93,628 | $21,686 | $71,942 |
| 2015 | $1,361 | $83,227 | $21,686 | $61,541 |
| 2014 | $1,307 | $78,583 | $18,992 | $59,591 |
Source: Public Records
Map
Nearby Homes
- 4024 W 4650 S
- 4097 W 4750 S
- 4094 W 4700 S
- 3671 W 4700 S
- 4890 S 4075 W
- 4106 W 4875 S
- 3692 W 4625 S
- 3669 W 4625 S
- 3820 Foxglen Dr
- 4141 W 4875 S
- 3627 W 4650 S
- 3632 W 4650 S
- 4990 S 4075 W
- 4021 W 5000 S
- 3652 W 4625 S
- Poplar Plan at Highgate Cove
- Pando Plan at Highgate Cove
- Villages Townhome Plan at Green Farm - Villages
- 5013 S 4150 W
- 4218 W 5050 S