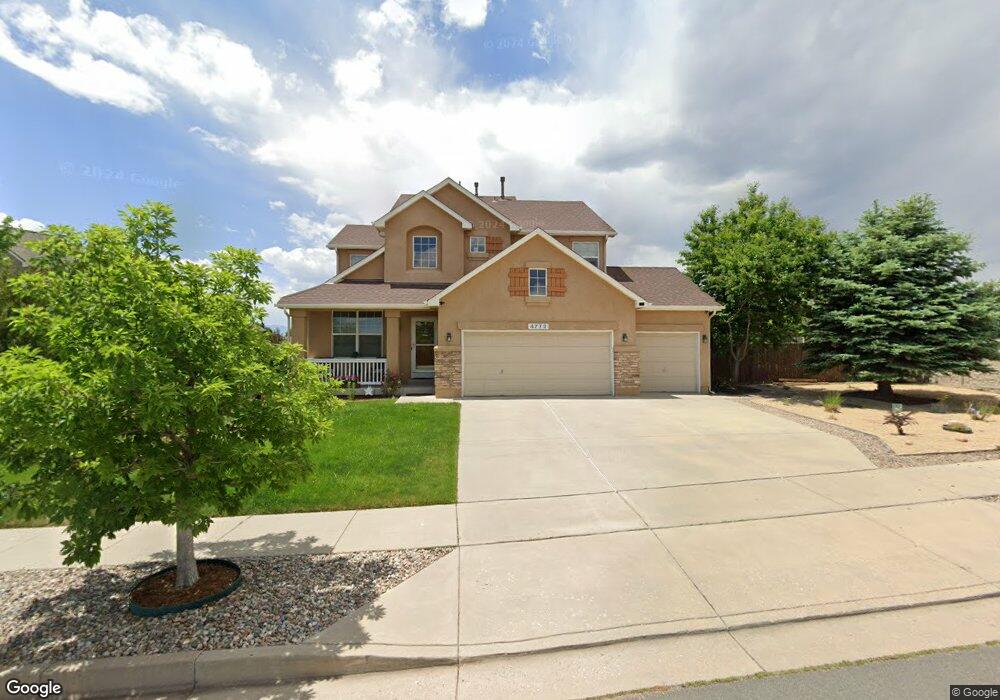
4772 Desert Varnish Dr Colorado Springs, CO 80922
Springs Ranch NeighborhoodEstimated Value: $561,000 - $584,000
4
Beds
3
Baths
3,426
Sq Ft
$168/Sq Ft
Est. Value
About This Home
This home is located at 4772 Desert Varnish Dr, Colorado Springs, CO 80922 and is currently estimated at $575,945, approximately $168 per square foot. 4772 Desert Varnish Dr is a home located in El Paso County with nearby schools including Springs Ranch Elementary School, Horizon Middle School, and Sand Creek High School.
Ownership History
Date
Name
Owned For
Owner Type
Purchase Details
Closed on
May 5, 2021
Sold by
Timberlake Kyle C and Timberlake Pamela L
Bought by
Ohara Sean A and Bertz Rosalie Marie
Current Estimated Value
Home Financials for this Owner
Home Financials are based on the most recent Mortgage that was taken out on this home.
Original Mortgage
$489,250
Outstanding Balance
$443,383
Interest Rate
3.1%
Mortgage Type
New Conventional
Estimated Equity
$132,562
Purchase Details
Closed on
Aug 17, 2016
Sold by
Sharkey Alan W and Timberlakde Sylvia L
Bought by
Timberlake Kyle C and Timberlake Sylvia L
Home Financials for this Owner
Home Financials are based on the most recent Mortgage that was taken out on this home.
Original Mortgage
$215,000
Interest Rate
3.41%
Mortgage Type
VA
Purchase Details
Closed on
Sep 9, 2004
Sold by
Keller Homes Inc
Bought by
Sharkey Alan W and Sharkey Sylvia M
Home Financials for this Owner
Home Financials are based on the most recent Mortgage that was taken out on this home.
Original Mortgage
$292,850
Interest Rate
5.95%
Mortgage Type
Unknown
Create a Home Valuation Report for This Property
The Home Valuation Report is an in-depth analysis detailing your home's value as well as a comparison with similar homes in the area
Home Values in the Area
Average Home Value in this Area
Purchase History
| Date | Buyer | Sale Price | Title Company |
|---|---|---|---|
| Ohara Sean A | $515,000 | Guardian Title | |
| Timberlake Kyle C | $315,000 | Fidelity National Title | |
| Sharkey Alan W | $308,280 | Land Title |
Source: Public Records
Mortgage History
| Date | Status | Borrower | Loan Amount |
|---|---|---|---|
| Open | Ohara Sean A | $489,250 | |
| Previous Owner | Timberlake Kyle C | $215,000 | |
| Previous Owner | Sharkey Alan W | $292,850 |
Source: Public Records
Tax History Compared to Growth
Tax History
| Year | Tax Paid | Tax Assessment Tax Assessment Total Assessment is a certain percentage of the fair market value that is determined by local assessors to be the total taxable value of land and additions on the property. | Land | Improvement |
|---|---|---|---|---|
| 2025 | $2,145 | $40,240 | -- | -- |
| 2024 | $2,045 | $39,830 | $6,470 | $33,360 |
| 2023 | $2,045 | $39,830 | $6,470 | $33,360 |
| 2022 | $1,752 | $30,050 | $5,840 | $24,210 |
| 2021 | $1,826 | $30,920 | $6,010 | $24,910 |
| 2020 | $1,508 | $25,220 | $5,010 | $20,210 |
| 2019 | $1,491 | $25,220 | $5,010 | $20,210 |
| 2018 | $1,376 | $22,810 | $4,380 | $18,430 |
| 2017 | $1,383 | $22,810 | $4,380 | $18,430 |
| 2016 | $1,604 | $26,070 | $4,120 | $21,950 |
| 2015 | $1,605 | $26,070 | $4,120 | $21,950 |
| 2014 | $1,637 | $26,070 | $3,900 | $22,170 |
Source: Public Records
Map
Nearby Homes
- 4741 Falcons Hood Point
- 4721 Falcons Hood Point
- 4831 Desert Varnish Dr
- 4655 Vireos View
- 7558 Patina Ct
- 4632 Hidden River Dr
- 7120 Highcroft Dr
- 4687 Pine Marten Point
- 7578 Lost Pony Place
- 4006 Gray Fox Heights
- 4604 Desert Varnish Dr
- 4661 Gray Fox Heights
- 4529 Crow Creek Dr
- 4930 Townsend Dr
- 4031 Gray Fox Heights Unit 335
- 7010 Highcroft Dr
- 7659 Marmot Point
- 5002 Sand Ripples Ln
- 4620 Gray Fox Heights
- 4489 Crow Creek Dr
- 4760 Desert Varnish Dr
- 7364 Gardenstone Dr
- 4791 Falcons Hood Point
- 7346 Gardenstone Dr
- 4781 Falcons Hood Point
- 4742 Falcons Hood Point
- 7383 Gardenstone Dr
- 4761 Falcons Hood Point
- 4771 Falcons Hood Point
- 7395 Willowind Dr
- 4732 Falcons Hood Point
- 7365 Gardenstone Dr
- 7383 Willowind Dr
- 7328 Gardenstone Dr
- 7419 Willowind Dr
- 7419 Hawkbill View
- 4731 Falcons Hood Point
- 7329 Gardenstone Dr
- 7431 Willowind Dr
- 4742 Desert Varnish Dr