Estimated Value: $324,000 - $374,000
3
Beds
2
Baths
1,280
Sq Ft
$281/Sq Ft
Est. Value
About This Home
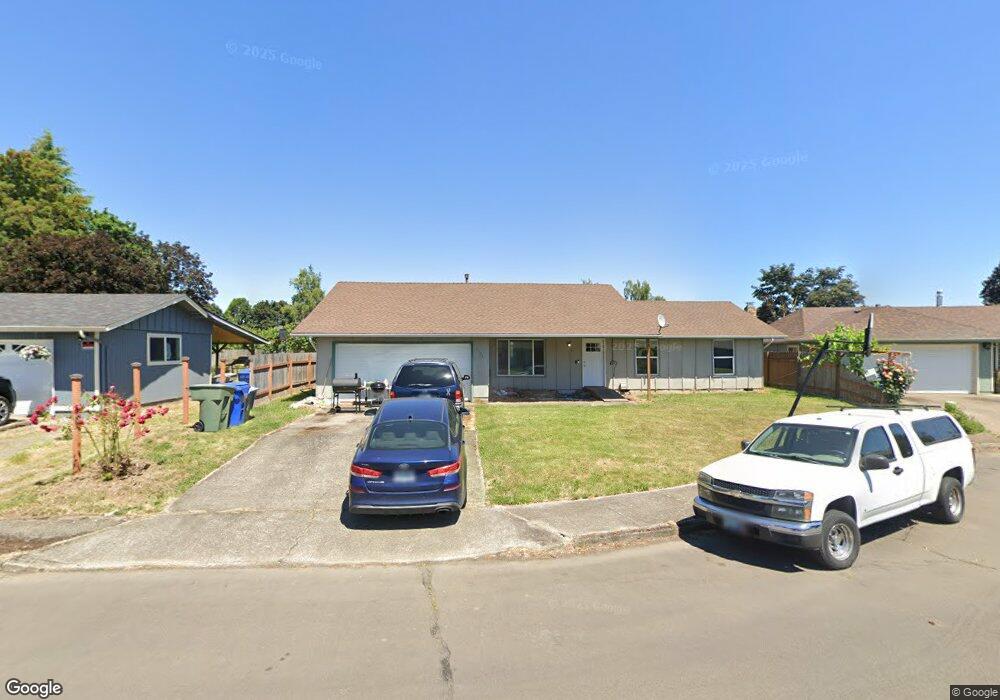
This home is located at 4773 Abiqua Ct SE, Salem, OR 97317 and is currently estimated at $359,532, approximately $280 per square foot. 4773 Abiqua Ct SE is a home located in Marion County with nearby schools including Eyre Elementary School, Houck Middle School, and South Salem High School.
Ownership History
Date
Name
Owned For
Owner Type
Purchase Details
Closed on
Mar 24, 2017
Sold by
Barnabas Real Estate Group Llc
Bought by
Greer Michael L and Greer Maxine S
Current Estimated Value
Home Financials for this Owner
Home Financials are based on the most recent Mortgage that was taken out on this home.
Original Mortgage
$152,192
Outstanding Balance
$126,360
Interest Rate
4.3%
Mortgage Type
FHA
Estimated Equity
$233,172
Purchase Details
Closed on
Oct 18, 2016
Sold by
Vantage Homes Llc
Bought by
Barnabas Real Estate Group Llc
Purchase Details
Closed on
Oct 12, 2016
Sold by
Jacobsen Harold Gary
Bought by
Vantage Homes Llc
Purchase Details
Closed on
Nov 20, 2014
Sold by
Jacobsen H Gary
Bought by
Jacobsen H G Ary and H Gary Jacobsen Living Trust
Purchase Details
Closed on
Oct 12, 2005
Sold by
Jacobsen Rick J and Gary Jacobsen H
Bought by
Jacobsen Rentals Llc
Create a Home Valuation Report for This Property
The Home Valuation Report is an in-depth analysis detailing your home's value as well as a comparison with similar homes in the area
Home Values in the Area
Average Home Value in this Area
Purchase History
| Date | Buyer | Sale Price | Title Company |
|---|---|---|---|
| Greer Michael L | $155,000 | Fidelity Natl Title Co Of Or | |
| Barnabas Real Estate Group Llc | $122,500 | Ticor Title | |
| Vantage Homes Llc | $100,500 | Fidelity Natl Title Co Of Or | |
| Jacobsen H G Ary | -- | None Available | |
| Jacobsen Rentals Llc | -- | -- |
Source: Public Records
Mortgage History
| Date | Status | Borrower | Loan Amount |
|---|---|---|---|
| Open | Greer Michael L | $152,192 |
Source: Public Records
Tax History Compared to Growth
Tax History
| Year | Tax Paid | Tax Assessment Tax Assessment Total Assessment is a certain percentage of the fair market value that is determined by local assessors to be the total taxable value of land and additions on the property. | Land | Improvement |
|---|---|---|---|---|
| 2025 | $2,644 | $163,630 | -- | -- |
| 2024 | $2,644 | $158,870 | -- | -- |
| 2023 | $2,508 | $154,250 | $0 | $0 |
| 2022 | $2,366 | $149,760 | $0 | $0 |
| 2021 | $2,343 | $145,400 | $0 | $0 |
| 2020 | $2,199 | $141,170 | $0 | $0 |
| 2019 | $2,216 | $137,060 | $0 | $0 |
| 2018 | $2,262 | $0 | $0 | $0 |
| 2017 | $1,918 | $0 | $0 | $0 |
| 2016 | $1,847 | $0 | $0 | $0 |
| 2015 | $1,829 | $0 | $0 | $0 |
| 2014 | $1,703 | $0 | $0 | $0 |
Source: Public Records
Map
Nearby Homes
- 4847 Adobe St SE
- 563 47th Place SE Unit 565
- 4723 Buckhorn Ct SE
- 260 49th Ave SE
- 4821-4823 Cougar Ct SE
- 4823 Cougar Ct SE
- 4955 Sooner Ln SE
- 4965 Arrowood Ct SE
- 4891 Fontana Ct SE
- 562 Connecticut Ave SE
- 148 Clearwater Ave NE
- 4944 Wagon Trail Ct SE
- 133 Broadmore Ave NE
- 280 Brink Ct SE
- 270 Brink Ct SE
- 4985 Wagon Rim Ct SE
- 0 Wagon Road Dr SE Unit 764266
- 0 Wagon Road Dr SE Unit 21655321
- 427 Lost Lake St NE
- 967 Shenandoah Dr SE
- 4753 Abiqua Ct SE
- 4738 Adobe St SE
- 4758 Adobe St SE
- 4783 Abiqua Ct SE
- 4733 Abiqua Ct SE
- 4728 Adobe St SE
- 4774 Abiqua Ct SE
- 4768 Adobe St SE
- 4754 Abiqua Ct SE
- 4793 Abiqua Ct SE
- 4784 Abiqua Ct SE
- 4734 Abiqua Ct SE
- 4723 Abiqua Ct SE
- 4718 Adobe St SE
- 4778 Adobe St SE
- 4775 Appaloosa Ct SE
- 4757 Adobe St SE
- 4737 Adobe St SE
- 4755 Appaloosa Ct SE
- 4724 Abiqua Ct SE